Open and Accurate Air Quality Monitors
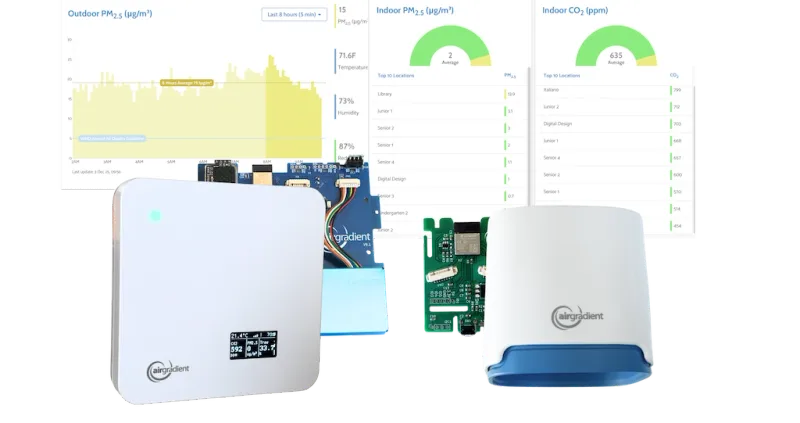
We design professional, accurate and long-lasting air quality monitors that are open-source and open-hardware so that you have full control on how you want to use the monitor.
Learn MoreLow-cost PM2.5 sensors are increasingly used for long-term air quality monitoring because they are affordable, easy to operate, and capable of delivering continuous, high-resolution data without the need for on-site maintenance. Their main limitation, however, is reduced accuracy compared to regulatory instruments, which, in turn, raises questions about their stability and the frequency of calibration required. A common concern is whether these sensors experience drift – a gradual change in response over time that could compromise data reliability. We decided to investigate to see if PM2.5 drift is something you need to worry about with your AirGradient monitors.
To assess drift, we analyzed continuous PM2.5 monitoring data from two locations that are part in our global colocation network:
We chose these sites because they feature low / medium, and high average PM2.5 concentrations, allowing assessment of the drift across different pollution levels. Each site has one beta attenuation monitor (BAM) as the reference-grade instrument and, alongside it, are co-located AirGradient (AG) monitors equipped with Plantower PMS5003T modules for measuring PM2.5.
Performance was evaluated using a 24 h (daily) resolution with EPA corrected data according to US EPA guidelines for low-cost sensor testing, using the following metrics:
The London dataset was aggregated by month, whereas the Chennai dataset was aggregated by week due to the limited amount of data available to quantify performance metrics.
In London, the average reference concentration for the two-year study period was 11.3 ug/m3 (Fig. 2), with 52% of measurements below 10 ug/m3. The precision among the four AG sensors was excellent, with a coefficient of variation of 6.1%.

The RMSE values stayed below the EPA target value (7 ug/m3) throughout the entire study, ranging from 1.9 to 7.0 ug/m3, indicating high accuracy. R2 values averaged 0.80 across all sensors without systematic drop or grow. The average slopes for AG1-AG4 were 1.2, 1.1, 1.1, and 1.1, respectively, with nearly all values falling within the EPA recommended range (Fig. 2).
In contrast to London, Chennai exhibited substantially higher PM2.5 concentrations, averaging 26.8 ug/m3, with no measurement below the detection limit (Fig. 3). The AG sensors demonstrated excellent precision (CV = 1.1%), high accuracy (average RMSE = 3.5 ug/m3), and strong correlations with the reference (R2 = 0.91). The average slopes averaged 0.96 for both sensors, with only one week dipping slightly below the EPA limit (Fig. 3). No temporal trends were observed for all of the performance metrics, indicating absence of systematic drift even at high concentrations.

Acknowledgements
We would like to thank the Imperial College London, UK and Sri Ramachandra Institute of Higher Education and Research (Deemed to be University), India for kindly providing the reference data for this study.

We design professional, accurate and long-lasting air quality monitors that are open-source and open-hardware so that you have full control on how you want to use the monitor.
Learn MoreCurious about upcoming webinars, company updates, and the latest air quality trends? Sign up for our weekly newsletter and get the inside scoop delivered straight to your inbox.
Join our Newsletter