We are entering the height of the so-called "Burning Season" in Northern Thailand. It is an annual recurring period of high air pollution due to wildfires and crop residue burning (primarily rice & corn). Now that we have many more outdoor monitors deployed in Northern Thailand, we can get a much better picture of the distribution of PM2.5 across the region. I'd like to share a few snapshots I took today and show that this dense network can bring quite some substantial benefits.
With benefits, I firstly mean a better understanding of the data (pollution situation) that can then subsequently bring massive improvements to the people's health by being able to protect themselves.
Two cities in Northern Thailand
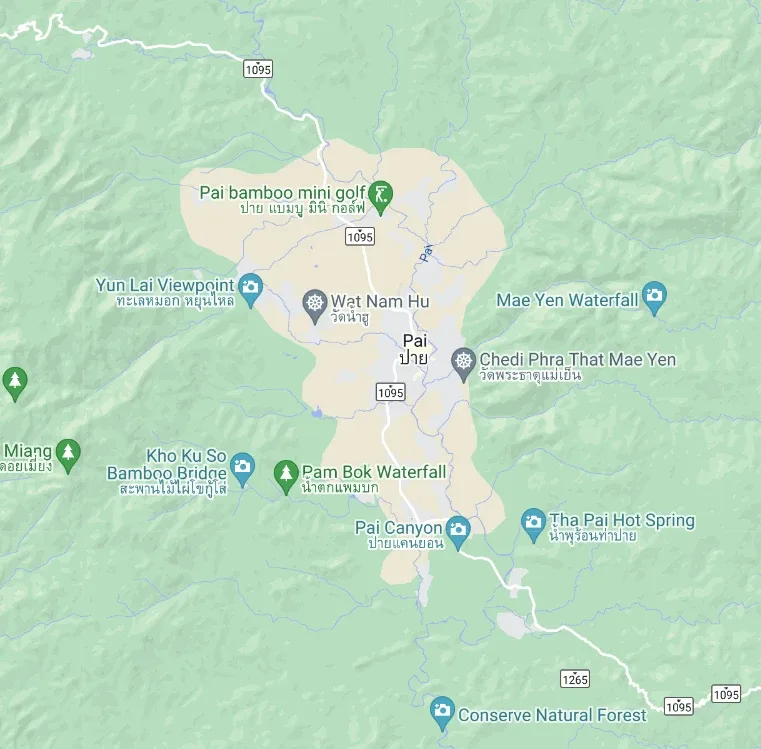
I'd like to start by comparing two cities in Northern Thailand where we have a good coverage of monitors. Pai and Chiang Mai. Pai is small, beautiful and loved by backpackers around the world. It is a closed valley surrounded by mountains and forests.
Chiang Mai is around 50 miles (80 kilometers) away, much bigger and with a more open landscape - especially towards the South-West.
Today on the AirGradient Map we can see a striking difference between these two cities"
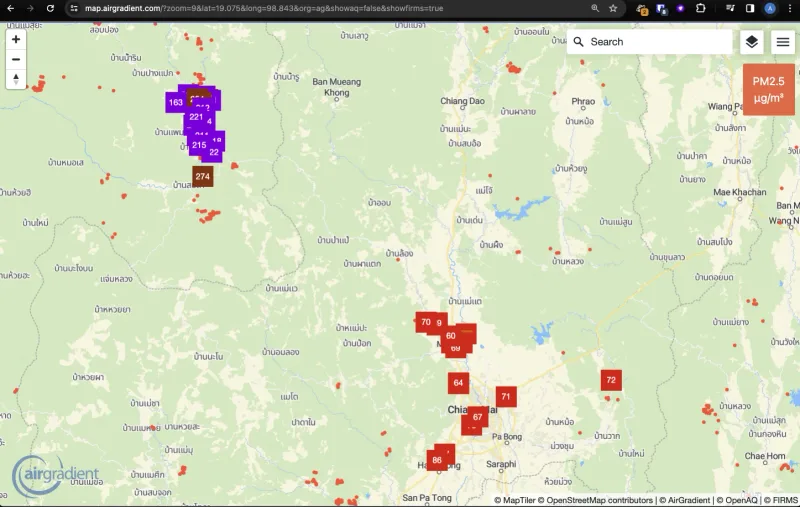
The air pollution with PM2.5 is around 4 times higher than in neighboring Chiang Mai and as per US EPA in the "Hazardous" range. Needless to say that these are extremely dangerous levels of air pollution and I do hope that the people there are able to protect themselves with masks and air purifiers. Or they can drive around 2 hours and get out of the worst smoke.
If we zoom out a bit and look at the whole of Northern Thailand we can actually see quite low pollution levels in the North-East. This area is all within a days travel distance by car or bus.
Northern Thailand
- north-thailand
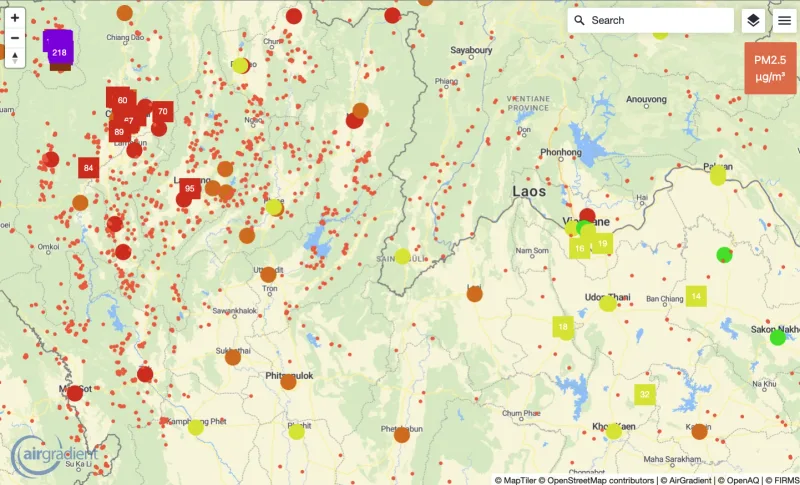
Above map not only contains AirGradient monitors but all stations from OpenAQ. Thus, we see nearly all stations that have an open-data policy and share their data with openAQ. So on this zoom level we see pretty much the whole spectrum of air quality from "Good" to "Hazardous".
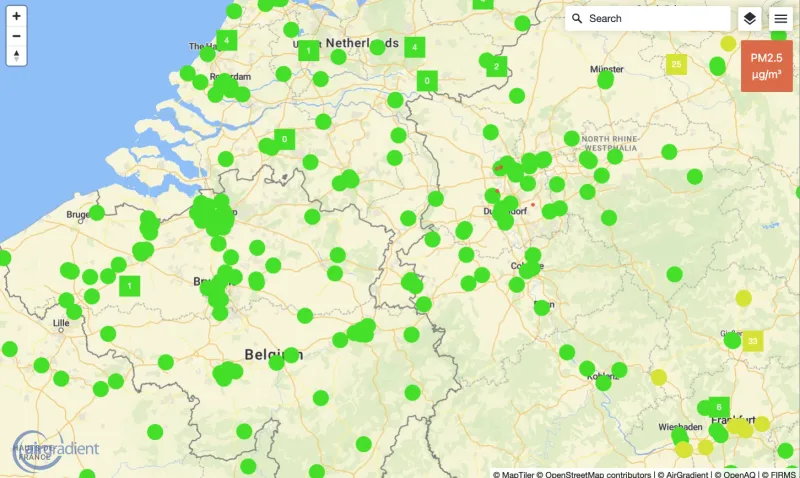
Now, lets use the same zoom level and look at two other areas:
Netherlands, Belgium and Germany
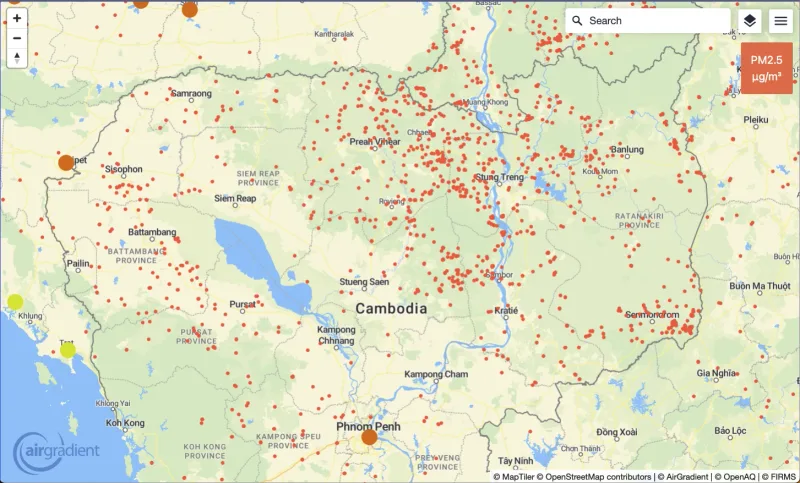
Cambodia