AirGradient is committed to providing monitors that can measure air pollution and meteorological parameters (temperature and relative humidity) with a high level of accuracy, suitable even for scientific use. To achieve this, we are comprehensively evaluating the performance of each individual sensor within our monitors.
In line with our core principles of data sharing and transparency, we openly publish all results from these performance analyses. To help everyone to understand these results, we are releasing a series of blog articles that explain the scientific concepts we use to characterise the performance of our monitors.
In this article, we illustrate the concepts of precision, accuracy, and reproducibility in the context of a sensor.
What’s the difference between precision and accuracy?
Both quantities are important when it comes to assessing the measurement performance of a sensor. But how do they differ?
The figure below illustrates the concepts of precision and accuracy using a dart board as an example.
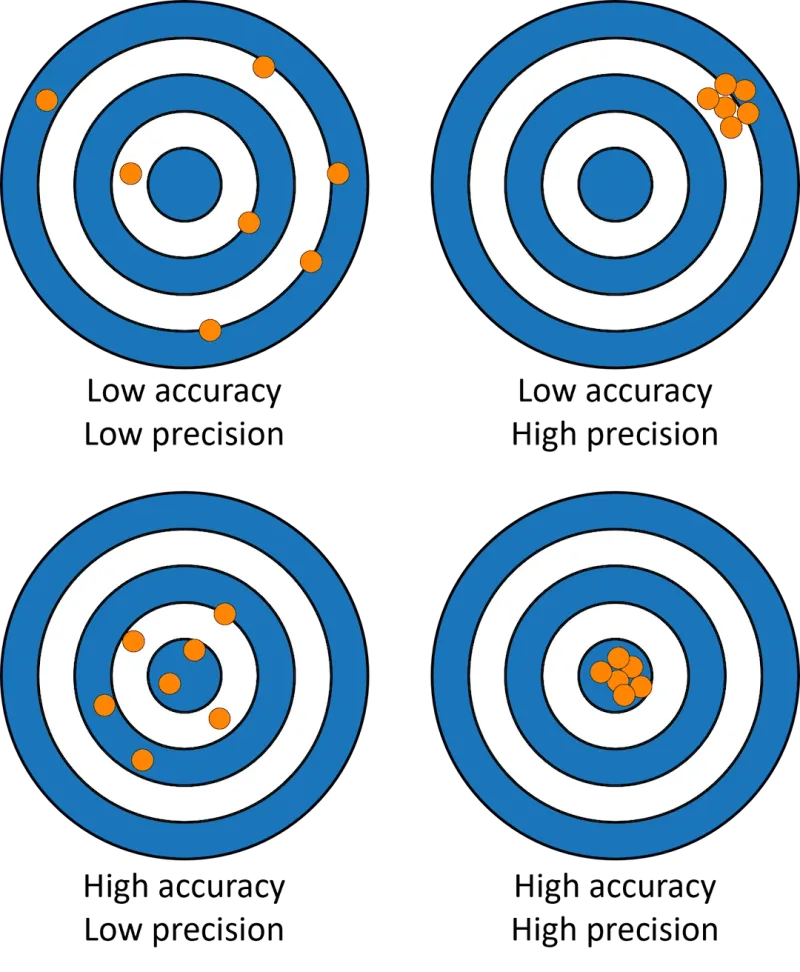
Precision
Precision refers to the consistency and repeatability of measurements. A precise measurement produces similar results when the same quantity is measured multiple times, even if those results are not close to the true value. The ideal way to determine the precision of an air quality monitor is to place it for a long time into a controlled environment with a defined air pollutant concentration and see how much its readings vary. However, such environments are difficult to create and can usually host only very few sensors at a time.
Reproducibility
A more common method to look at the consistency of air quality measurements is to place multiple sensors of the same kind in one location (= co-location) and see how much the measurements differ between them. We usually refer to this as reproducibility analysis.
Accuracy
Accuracy, on the other hand, refers to how close a measurement is to the true or target value, regardless of whether it's consistently reproducible. In the context of air quality monitors, accuracy means that the tested sensor should measure the same value as a reference monitor when they are placed together in the same location.
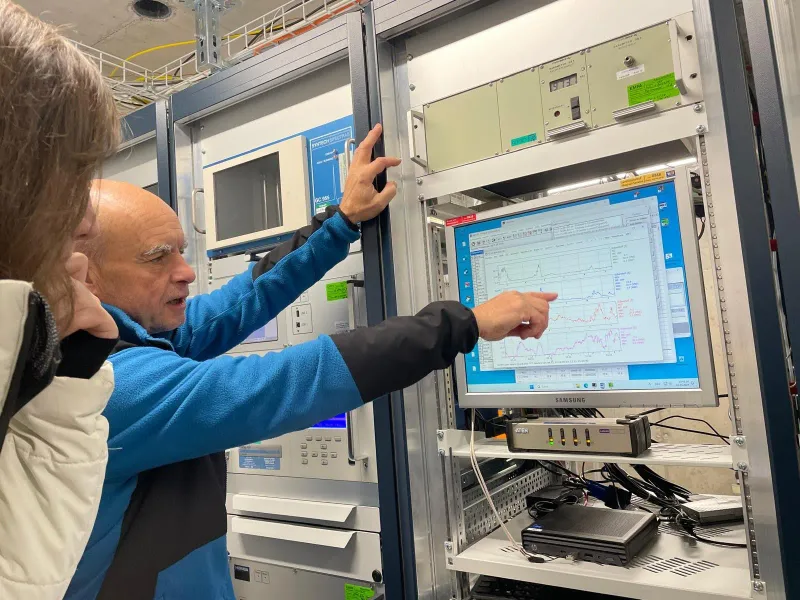
A reference monitor should ideally be an officially recognized reference-grade instrument, representing the scientific standard for air quality monitoring. This equipment is significantly larger and more expensive compared to small sensors, requiring regular maintenance and calibration while adhering to strict standards for measurement performance.
Performance parameters
When assessing reproducibility, we compare a sensor with another one of the same kind. To determine accuracy, we compare a sensor with a reference measurement. In both cases, we examine the agreement between two variables, with higher agreement indicating better sensor performance. To quantify this agreement, one can look at various performance parameters such as the coefficient of determination R² or the Root Mean Square Error (RMSE). They can be used to evaluate both the accuracy and reproducibility of a sensor. We further explain these parameters in separate blog articles.
Sensor drift as an example for precision and accuracy
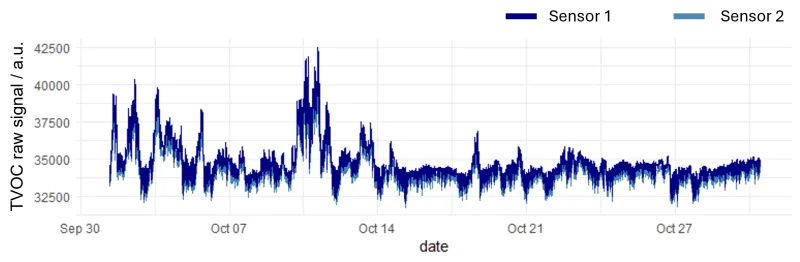
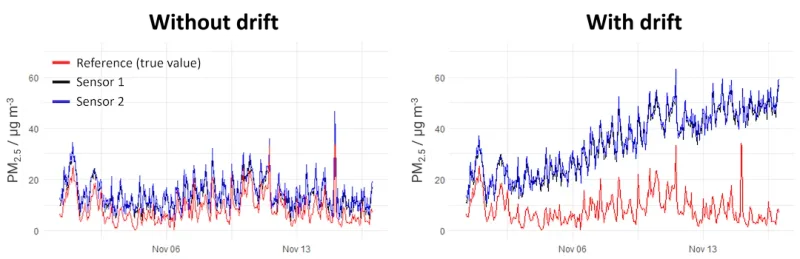
To understand why it’s important to consider the precision AND accuracy of a sensor, have a look at Figure 2. It shows the PM2.5 measurements of two low-cost sensors compared to a reference-grade instrument. The sensors on the right side suffer from drift, i.e. their measurements change over time, possibly due to the ageing of certain components. The sensors on the left do not experience any drift.
The measurements from the drift-free sensors are close to the reference measurements, indicating high accuracy. In contrast, the drifting sensors progressively deviate from the reference over time, suggesting a decline in accuracy. But in both cases, the measurements of Sensor 1 and Sensor 2 are almost identical, reflecting high reproducibility and, consequently, high precision. So just looking at the reproducibility wouldn’t have given you enough information to assess the sensor performance. However, the high reproducibility suggests that the sensors suffer from a systematic drift that could potentially be corrected using compensation algorithms.
How does AirGradient assess their sensing performance?
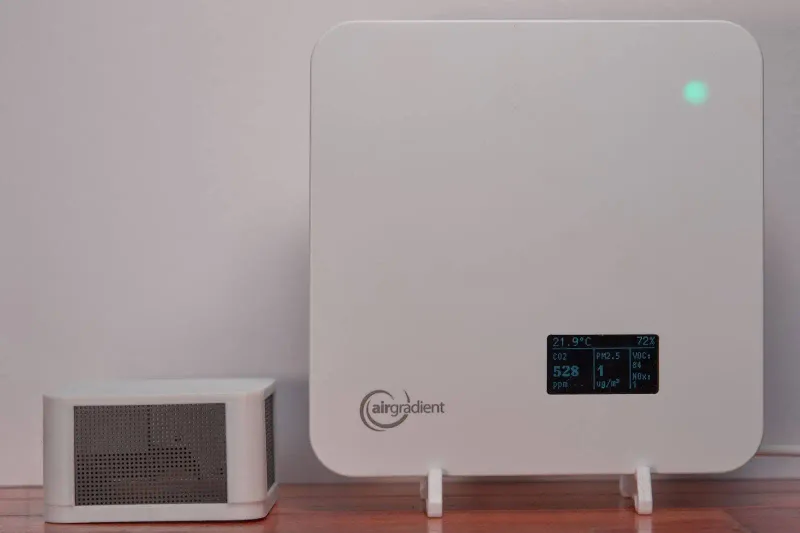
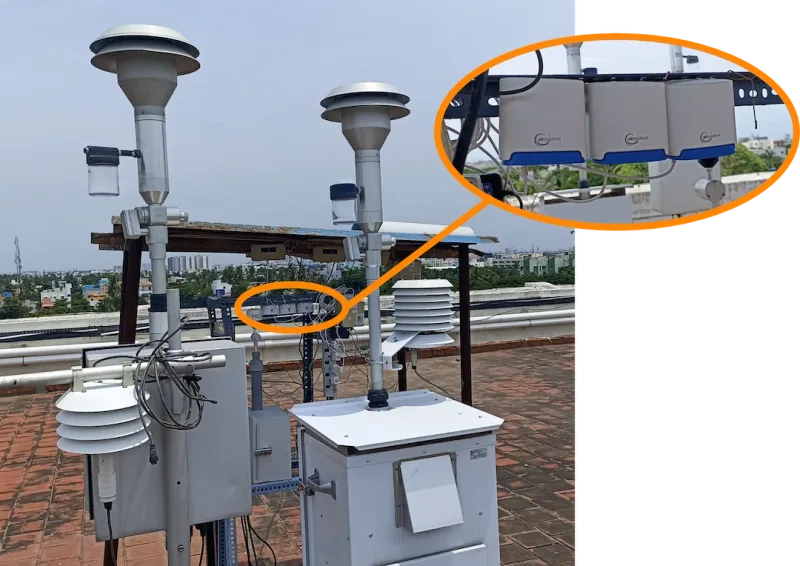
To evaluate the accuracy, reproducibility and drift of the AirGradient monitors under different environmental conditions, we have co-located them with reference instruments in over 25 locations across the globe (see figures below). You can find more information about the co-location project here.

In addition to this, all our fully assembled monitors also go through our test chamber to make sure that they perform as expected. Here is a picture of a large batch of AirGradient ONE going through the test cycle:
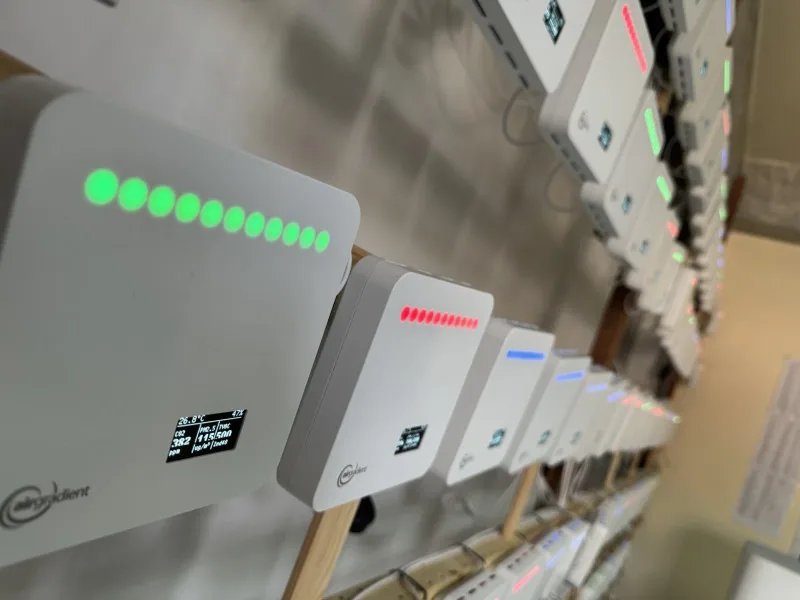
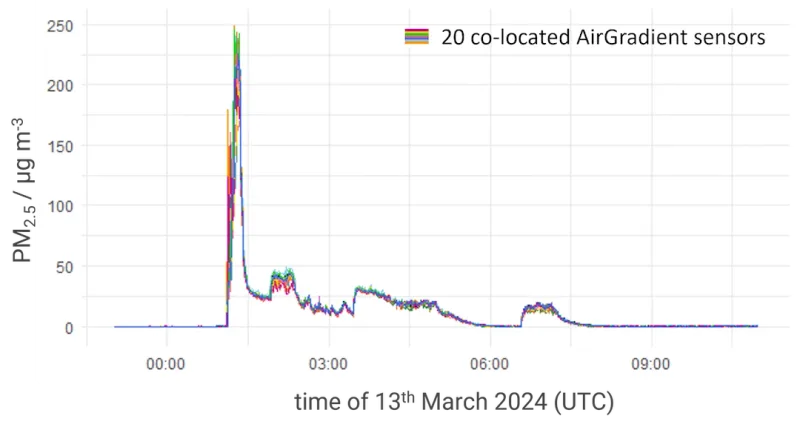
Figure 6 shows the PM2.5 measurements of 20 monitors from the photo above. They all follow the same line, i.e. they all measure the same concentrations when exposed to the same conditions. From this (and further more quantitative tests) we can conclude that the reproducibility of the AirGradient PM sensors is excellent.
We not only test the different air quality sensors but also other features of the monitor, e.g. the RGB LED bar which you can see in the above picture.
These test results are automatically saved in our database and are later available for reference in case a monitor experiences any issues.
Stay tuned for more articles about this series on performance evaluation of air quality monitors. If you have any questions, get in touch with us.