Open and Accurate Air Quality Monitors
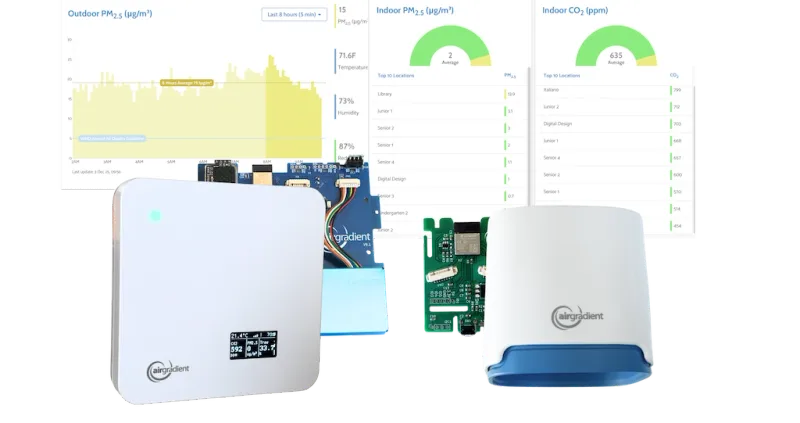
We design professional, accurate and long-lasting air quality monitors that are open-source and open-hardware so that you have full control on how you want to use the monitor.
Learn MoreNot all particulate matter is created equal. Two environments can show the same PM2.5 value on a monitor, yet be composed of completely different types of particles. One might be mostly fine soot, the other made up of coarse dust. To a typical user, these differences are invisible, but to the sensor inside your monitor, they matter a great deal.
At AirGradient, we believe understanding these nuances is essential, especially when it comes to evaluating how accurate or meaningful an air quality monitor truly is.
To investigate this, we compared the particle size distributions of two pollution sources:
The results, measured with a reference-grade instrument, showed a clear difference in the mass distribution by particle size:

Even though both scenarios could register the same PM2.5 concentration, the actual particle profiles are very different - and probably also the associated health risks.
High-end optical FEM monitors use single‑particle counting: each particle passing through the laser beam produces a scattering pulse, and the intensity of that pulse is used, after calibration, to assign the particle to a size bin. At high loads they correct for “coincidence” (two or more particles in the beam at once) by using design features and correction algorithms to minimize the effect.
In contrast, low‑cost optical PM sensors convert a single total‑scattering signal into mass using an assumed size distribution. This means they cannot distinguish whether the light came from one large particle or many smaller ones. Their internal algorithms make assumptions about particle size distributions, so the reported PM2.5 or PM10 values can be biased if the true distribution is different. This mismatch between assumed and actual distributions introduces bias, particularly during incense, fresh wildfire smoke, or dust‑heavy events.
This creates a core challenge:
A low‑cost optical PM sensor calibrated using incense smoke might perform well in a lab. But in real-world ambient air, with its different particle mix, it may systematically over- or underestimate pollution levels.
This disconnect complicates any effort to compare monitors, interpret readings across regions, or evaluate accuracy based solely on lab testing.
The key takeaway: Without matching the sensor’s calibration aerosol profile to its deployment environment, accuracy can suffer meaningfully.
This is why it’s strongly recommended, where feasible, to calibrate sensors locally, in the same environment and conditions where they’ll be deployed.
Most low-cost air quality monitor manufacturers gloss over this issue. We think it’s too important to ignore.
AirGradient is built on a foundation of openness and transparency. We share these insights not to overwhelm, but to inform and to invite conversation. If you’re comparing monitors, conducting your own testing, or just trying to make sense of the numbers, understanding particle size differences is key.
This is a complex topic, and we’re still learning too. If you have questions, thoughts, or ideas on better calibration methods or testing protocols, we’d love to hear them.
Reach out anytime or join the discussion in our community forum.
The goal isn’t perfection but clarity. And it starts with understanding what our monitors are really measuring.

We design professional, accurate and long-lasting air quality monitors that are open-source and open-hardware so that you have full control on how you want to use the monitor.
Learn MoreCurious about upcoming webinars, company updates, and the latest air quality trends? Sign up for our weekly newsletter and get the inside scoop delivered straight to your inbox.
Join our Newsletter