Enhance the Accuracy of the PMS Sensors
Enhance the Accuracy of the PMS Sensors
Newer batches of the Plantower PMS5003 sensors that -although working completely correctly and within their specs- can be made more accurate in lower concentration ranges. Below instructions explain how to identify these sensor modules, and apply the calibration factors if you like to get the most accuracy out of the modules.
If you want to read more about how this issue surfaced and how the below calibration was developed, read this blog post but note that this blog post is no longer updated.
Please note that applying the calibration to an older batch of Plantower sensors can lead to them making a large overestimation and throwing off all of your PM2.5 readings. Therefore, the first and a very important step is to identify which PM sensor you have.
Note: The below steps apply to DIY-Kit. They are no longer necessary for fully-assembled units. Learn more about the update here: https://www.airgradient.com/blog/version-2-test-report-and-procedure.
Check the Dashboard
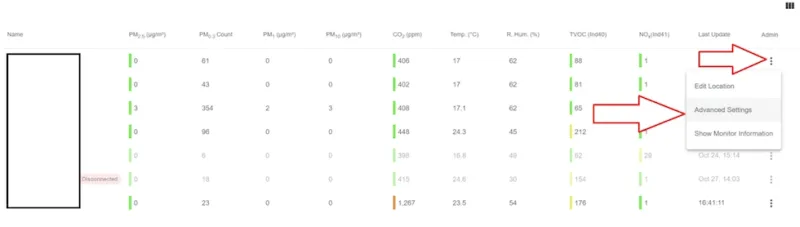
The first and easiest way to check for an affected sensor is to check the dashboard. Below, highlighted in red, are two sensors exhibiting this issue, followed by two working. At first glance, they look very similar as the monitors are in a very clean environment.
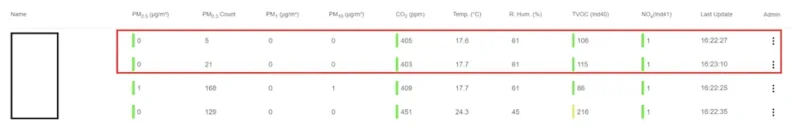
However, as soon as we look at more data (click on the PM2.5 value in the first column), we can see a big difference in the measurements taken by each sensor. Below are the measurements one of the working monitors took over the past 48 hours.
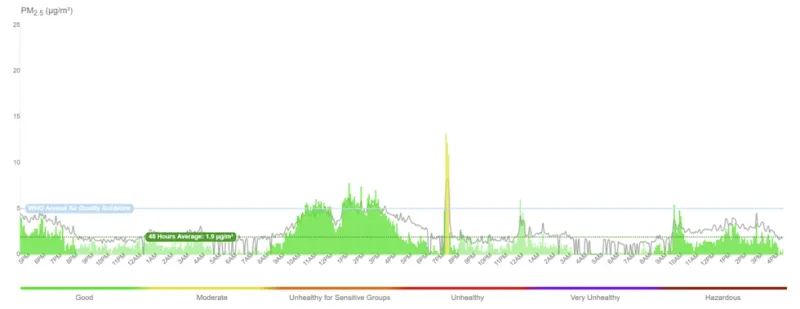
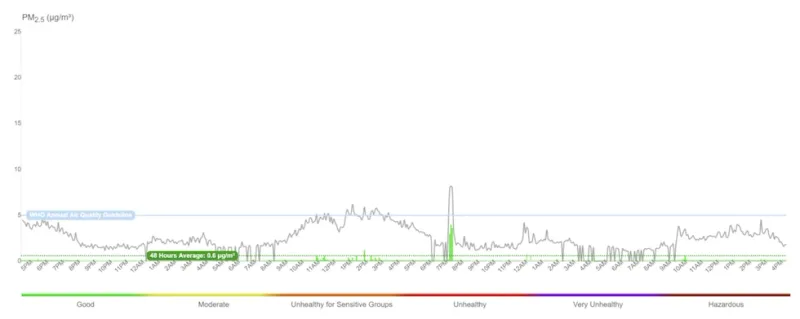
As you can see, there are regular fluctuations, which we would expect in a normal environment. When looking at one of the two too-low sensors (which are co-located) over the same time period, there is a very obvious difference. As you can see below, except for during the largest spike, the monitor almost consistently reads 0ug/m3 of PM2.5. If your monitor shows a graph like this, it will likely have this issue and need to be calibrated. It is important that these differences are still within the manufacturers specified accuract range of +- 10 ug/m3.
We are working on identifying these sensor modules automatically but until this is implemented you can follow below steps:
You will need to open your monitor to view the sensor’s serial number. You can do this quickly by unscrewing the four screws in the back of your monitor. Don’t worry - if you purchased a pre-assembled monitor, opening the device will not void any warranty you have.
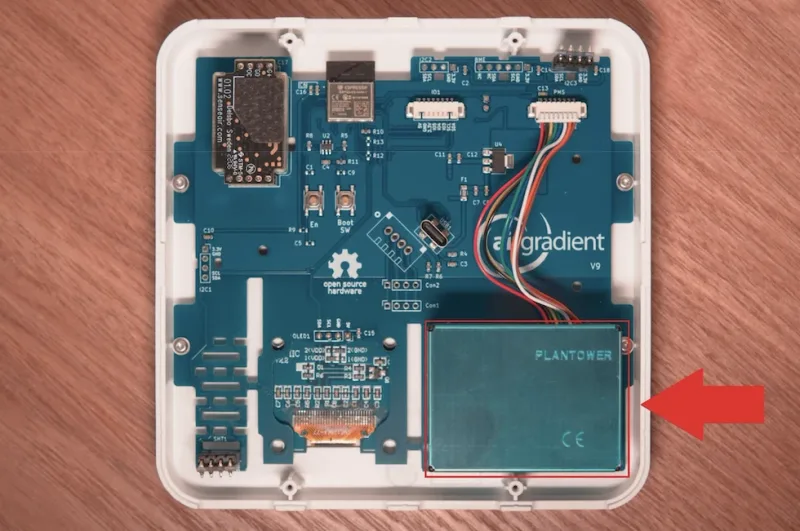
Now, you will want to locate the largest sensor, which stands out as it’s a large blue box with the word PLANTOWER engraved on it. On the side of this sensor (the right hand side if the word is correctly orientated), you will find a sticker with a barcode, and, importantly, a number. The number will have a similar format to the following:
PMS5003-2023070405549
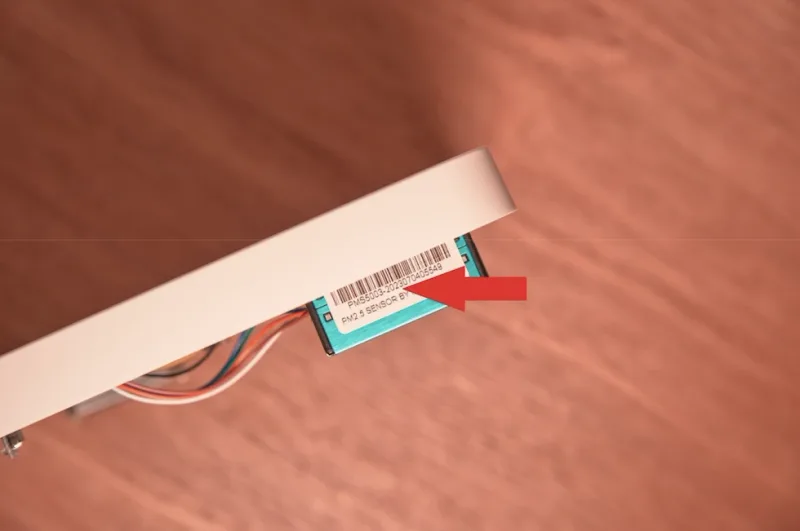
You will only need to pay attention to the first few numbers, representing the year, month and day the sensors were produced. So far, we’ve noticed issues with and released calibrations for monitors that begin with the following combinations:
PMS5003-20231218
PMS5003-20240104
PMS5003-20231030
If you have this issue but have a sensor with a different batch number, please let us know via our customer support. If you do have a sensor with one of these batch numbers, you can now reassemble your monitor, plug it in, and head to your dashboard.
Back on the dashboard, you will want to navigate to the admin menu which is the final column shown for monitors on your homescreen. Under this menu, select ‘Advanced Settings’.
On the first page of this menu (PM2.5), you will be able to apply a calibration formula as seen in the screenshot below. Select the formula with the number that matches the beginning of your sensor’s serial number. You can now apply the EPA formula on top of the calibration if you like.
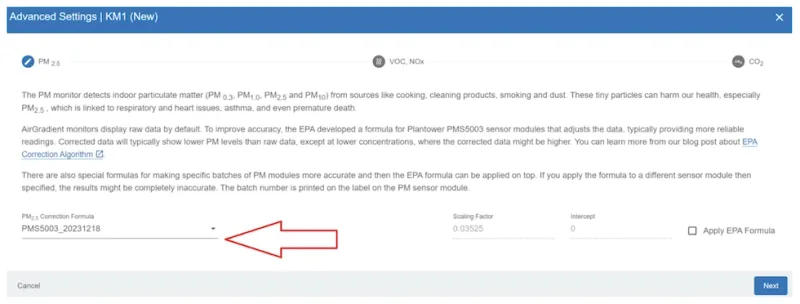
As soon as you change the formula in the drop-down menu, it will be saved for your dashboard.
You can also apply the EPA formula on top by selecting the checkbox. The EPA formula has been developed by the US EPA and improves the accuracy further, especially for areas close to wildfires.
You can either close this window via the X in the top-right corner or click ‘next’ to edit your VOC, NOx and CO2 settings, too.
This should remedy the issue and you will see normal readings again. If you do encounter any issues with this process, please let us know and we will do our best to assist you.
Thank you for your patience while we are working to make this adjustment automatically.
Calibration on Mobile Apps
If you do the calibration on the mobile apps, go to the calibration section in the detailed view of that particular monitor, then for PM Calibration select "Custom via PM count" and add the scaling factor and offset as per the table on this page according to the PMS module you identified above.