Community Engagement
Community engagement does not end once your monitoring network is deployed. In fact, this is where long-term relationships and trust matter most. The ongoing involvement of your community is essential to ensure that the project remains relevant, supported, and impactful.
In P3:Community Engagement Planning chapter, the three different stakeholder groups were introduced to support your project:
- Community Connectors – individuals or institutions that can amplify your messages (e.g., schools, community leaders, media).
- Project Supporters – those helping with operations (e.g., volunteers, residents hosting sensors).
- Impact Drivers – people or institutions who can translate your data into action (e.g., researchers, policymakers, advocacy groups).
This chapter guides you through how to sustain the involvement of these stakeholders (whether or not you work with all three stakeholder groups), communicate results in clear and accessible ways, encourage positive behaviors, support policy change, and respond to concerns and risks.
1. Engaged Community = Healthy Sensor Network
Even the most carefully planned air quality monitoring project can be disrupted if your sensor network is not protected. Vandalism, theft, and neglect are very real risks, especially if people don’t understand what the monitors are for, or worse—if they see them as invasive or dangerous. That’s why community engagement is not just about awareness or education. It’s also about safeguarding the project itself.
A reliable sensor network is the foundation of your project’s success. But maintaining this network isn’t just a technical task. It’s also a community effort. The more involved and informed your community is, the more likely the monitors will remain safe, functional, and respected.
If you’ve partnered with Project Supporters, such as residents hosting sensors, local volunteers, or maybe even your
classmates, regular check-ins and guidance can go a long way! Share simple instructions for how to identify connection
issues, report blinking lights, or clean sensors when needed, as described more in detail in
Chapters O4.1, O4.2, and
O4.3.
Encourage them to reach out if they notice anything unusual, and provide easy ways for them to get support.
Additionally, make sure they know how to report issues quickly and feel appreciated for their role in keeping the
network running.
Community Connectors can also help! They can share important information about how to take care of the monitors they see around the community. They can also help in allowing signages, posters, or QR codes near sensors that explain their purpose and invite the public to learn more.
Building trust and visibility around your project is one of the best protections against vandalism and theft. The more your project is seen as a shared community resource, the more likely it is to be supported and safeguarded over time.
2. Communicating Results to the Community
Communicating your air quality findings back to the community is essential for transparency, understanding, and action.
2.1. Strategizing How You Can Communicate
Present air quality information in plain language, with minimal technical terms. Visuals (charts, infographics, icons) can help simplify complex data. Translate into local languages if necessary.
There are many approaches you can take. Remember, it all depends on who you are communicating the data to:
- Visual Approach: Do you think your community would benefit from a more creative approach? Try creating infographics, charts, or QR-coded posters that direct people to the AirGradient map to make complex data easy to understand. You can find help on how to visualise air quality data in Chapter O5: Data Visualisation Analysis, and Interpretation.
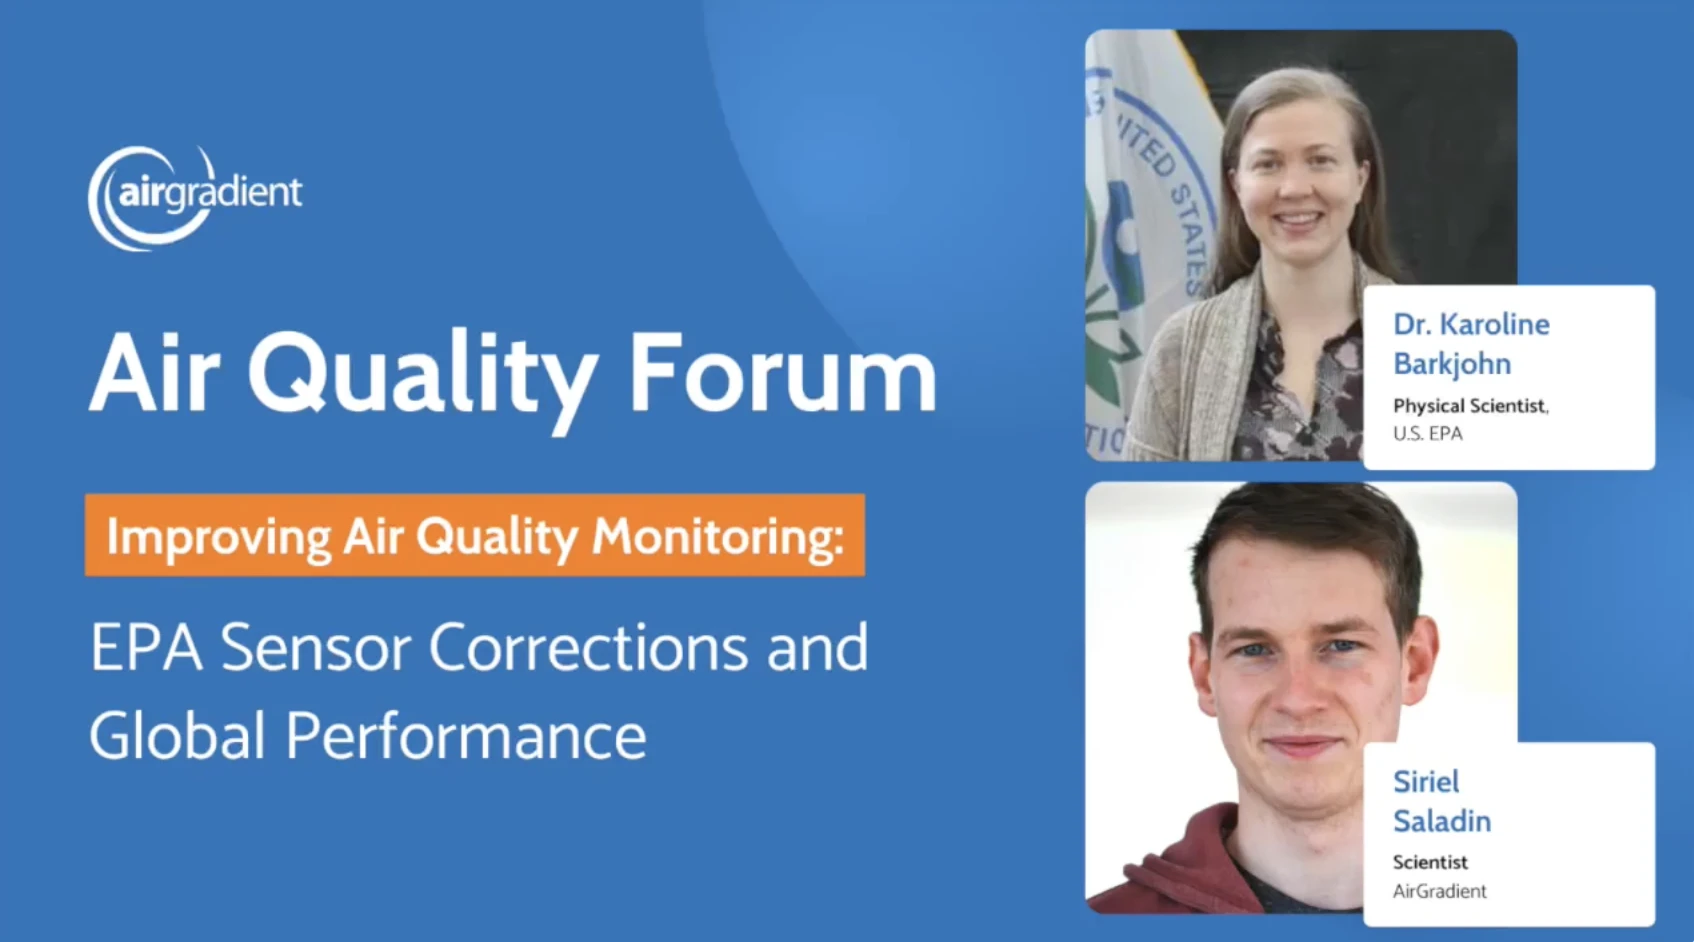
- Detailed Reports: Maybe your community (e.g. policy makers) is more data driven and is more interested in understanding air quality data in greater detail. If this is the case, try providing them with in-depth scientific reports, case studies, or presentations. An example is seen in figure 2.
- Health-focused Messaging: Some communities are more concerned about how air quality affects their health and overall well-being. In this case, try partnering with healthcare providers to create simple advisories, share air quality alerts in clinics, or organize community health talks on topics like reducing exposure to pollution.
2.2. Maintaining and Improving the Right Communication Channels
By the time your project enters the operational phase, you’ve likely already established communication pathways with your stakeholders through community meetings, newsletters, instant messaging groups, posters, or town hall events. Now is the time to reflect: what worked, and what didn’t?
Ask yourself and your team:
- Which channels reached the most people?
- Where did you receive the most feedback or engagement?
- What platforms did different groups prefer (e.g., elders, students, health workers)?
- Were there communication gaps—people or places you failed to reach?
You don’t need to reinvent your communications strategy, but there may be a need to fine-tune it depending on how effective it is. This could mean continuing with your strongest methods while improving the ones that fell short.
For example, maybe your printed posters were highly visible, but people didn’t understand the technical terms. In that case, keep the posters but update the messaging to be clearer and more actionable. If your WhatsApp group went quiet, consider prompting it with short data updates or community shout-outs. If your school assemblies have generated a lot of discussion, plan them more regularly or share updates through teachers.
One useful approach is to schedule regular “communications check-ins”. Every few months, assess how your chosen channels are performing. Speak with community members, supporters, and connectors. Ask them:
- Are they still getting the updates?
- Do they feel informed?
- Is there a better way they’d prefer to receive information?
Also, make sure you’re balancing one-way communication (sharing data and updates) with two-way engagement ( listening and responding). Encourage comments, questions, and suggestions. Create simple ways for people to respond, like anonymous feedback boxes or online forms for community input.
The most effective communication channels are not just the loudest, they’re the ones that make people feel seen, included, and equipped to act. Revisit your methods regularly, be open to feedback, and stay flexible. Communication during operations should never be static– it should evolve as your community’s needs, habits, and concerns evolve.
2.3. Make It Relatable
For data to have real-world impact, people need to see how it affects their regular routines, their health, and the choices they make.
The best place to start is by asking: “What does this data mean for our lives today?”
For instance, if your monitors show that PM2.5 levels consistently spike between 3:00–5:00 PM, your message shouldn’t be limited to reporting that fact. Help the community interpret it:
“Air pollution is highest between 3 and 5 in the afternoon, likely due to traffic congestion. If possible, avoid outdoor activities at this time, or take alternative routes to reduce exposure.”
Link the data to real decisions: when to go for a walk, how to get to work, or when to wear a mask. Instead of abstract readings, show how air quality connects to moments people recognize: school pick-up, market rush hours, or early morning commuting.
If your audience includes specific groups, like parents, elderly residents, or people with respiratory conditions, make sure your messaging reflects their realities. For example:
“On high-pollution days, children and elders are more at risk. If you care for someone vulnerable, reduce their exposure by staying indoors, using air purifiers or an air filter mask.”
Design your data sharing tools to be visually intuitive. Use color-coded charts, air quality emojis, or simple icons. A green smiley face can mean “good air,” while a red warning symbol could indicate “pollution alert.” The simpler the visuals, the more accessible they’ll be to people with different levels of education or literacy.
Also, don’t be afraid to repeat key insights across platforms and over time. Familiarity builds understanding. When a message is repeated in community meetings, instant messaging updates, and posters at the clinic, it sticks and slowly becomes part of how people think and talk about their environment.
2.4. Other Involvement
Community engagement becomes stronger when it’s not limited to one voice or one team. One of the most effective ways to sustain momentum and ensure long-term support is to involve other local actors who can amplify your message, broaden your reach, and help embed air quality awareness into daily life.
Schools are one of the most powerful partners in this phase. Even if your project didn’t initially focus on education, now could be a great time to build relationships with teachers or school administrators. Real-time air quality data can be integrated into science or geography lessons, giving students a local and tangible way to understand environmental issues. Schools can also use data for student-led projects, like air quality journaling, creating awareness posters, or tracking pollution patterns around campus.
If you’re already working with a school, take it further. Display data on bulletin boards, hold mini-workshops, or ask students to design behavior change campaigns for their families or neighborhoods. Young people are often passionate advocates, and when they get involved, parents listen.
Youth groups, whether formal or informal, also offer great opportunities for engagement. Scouts, church-based youth programs, sports clubs, or university groups can take part in local campaigns, help disseminate data, or even assist with simple monitor checks. Their involvement not only increases manpower, but also it signals to the broader community that air quality is an issue the next generation is taking seriously.
Beyond schools and youth, partnering with local organizations can unlock new avenues for engagement. Think about:
- Health clinics or public health officers who can help explain the health risks of poor air quality and what actions to take;
- Environmental groups who may be interested in organizing clean-up drives, tree-planting days, or advocacy events;
- Local businesses who may display your messaging or offer discounts for greener behaviors (e.g., “show us your bike helmet, get 10% off”).
The key is to make participation easy and mutually beneficial. Offer simple resources like talking points, printouts, or visual summaries that others can adapt and share in their own way. These groups don’t need to be air quality experts; they just need to see the value in what your project is offering and feel confident sharing it with their communities.
By inviting others to join your project, you’re not only spreading your message—you’re building a shared culture of awareness and action. And that’s what turns a monitoring project into a movement.
3. Encouraging and Celebrating Action
Once your community understands the air quality data and how it connects to daily life as was mentioned above in Section 2.3, the next step is to nurture and sustain behavior change. This involves reinforcing healthy habits (such as checking AQ levels before going outside, using clean transportation, avoiding open burning, or wearing masks on high pollution days), offering encouragement, and building a culture of shared responsibility.
Repetition matters. Regular, consistent reminders through the same trusted channels you’ve been using can help keep air quality top of mind. Reinforce key messages during pollution peaks, or tie them into ongoing community events. Even a short weekly tip or a message on a school board can help embed new behaviors.
Recognize and celebrate change. Acknowledging positive behaviors, no matter how small, helps build momentum. Highlight individuals or groups who have adjusted their routines or taken initiative. Share short stories in your newsletters or instant messaging groups: a local business reducing waste burning, a family walking instead of driving to school, or youth running a clean-air campaign.
Make it feel collective. When people see that others around them are taking action, it strengthens their own commitment. Use phrases like “We’ve seen less idling in the past week,” or “More families are adjusting routines on poor air days.” This shared narrative builds community pride and encourages more people to get involved.
Adapt to your audience. The actions that matter most will depend on who you’re engaging. For example:
- In areas with vulnerable groups like young children or the elderly, emphasize exposure reduction.
- In busy neighborhoods with lots of traffic, focus on driver behaviors and alternatives.
- Among students or young people, support peer-led ideas and creative engagement.
Different stakeholders can move this forward. Community Connectors play a vital role in reinforcing these behavior
changes. By embedding air quality messages into daily routines, school programs, or community gatherings, they help
normalize new habits and spread them more widely.
Similarly, Impact Drivers like healthcare workers, researchers, or advocacy groups can lend credibility to these
efforts. Their expertise can help explain the health benefits of certain behaviors, offer practical advice, and provide
a science-backed rationale that encourages people to take action. When trusted voices amplify your calls to action, your
messages are more likely to be taken seriously and adopted consistently.
The goal is not just to inform, but to empower! Show that even simple choices can contribute to a cleaner, healthier environment for everyone.
4. Encouraging New Policies and Legislation
While individual actions are essential, achieving broader and longer-term improvements in air quality often requires structural change. One of the most powerful ways your monitoring project can drive systemic impact is by contributing to evidence-based policymaking. The data you collect over time can help identify pollution hotspots, reveal recurring patterns, and provide the solid grounding needed to propose informed interventions.
To begin with, focus on making your data actionable for decision-makers. Is there a particular intersection where pollution peaks every afternoon? A neighborhood where PM2.5 levels consistently exceed safe limits during cooking hours? These patterns, when shared clearly and confidently, can guide the creation of school pick-up traffic policies, restrictions on burning activities, or urban planning adjustments that prioritize cleaner air. Even without formal legislative changes, your data can shape practical decisions, like where to plant trees, redirect traffic, or improve public transport.
Here, Impact Drivers such as policymakers, researchers, and environmental or health-focused organizations are instrumental. Their involvement helps translate your community’s lived experiences and sensor readings into credible recommendations and public advocacy. Researchers may help analyze trends, quantify health risks, or draft technical reports, while NGOs and advocacy groups can amplify these findings in campaigns and policy dialogues. Policymakers themselves, when included early and often, are more likely to understand the context behind your data and act on it.
As policies begin to shift, whether it’s the introduction of a new clean air regulation or a local ban on certain polluting practices, make sure to celebrate and document those milestones. Share the wins with your community and acknowledge how their participation and vigilance contributed to meaningful change. This strengthens motivation and reinforces the idea that community-led monitoring is not only informative, but influential.
Finally, don’t stop measuring once a policy is in place. Continued monitoring helps assess whether interventions are working and keeps the conversation going. Are air quality levels improving? Are pollution peaks decreasing in intensity or frequency? The ability to track these changes gives your project long-term relevance and allows you to advocate for policy refinement if needed. There’s an impact log you can find in Chapter O8: Measuring Your Impact, that you can utilize for your documentation.
Developed by AirGradient in Collaboration with the UNDP Global Centre Singapore CC-BY-SA