Dashboard Manual
By this point, you’ve already deployed your monitors and ensured they are working properly and giving accurate data. Now, it’s time to learn how to fully utilise the dashboard and customize your experience so you can get the most out of your AirGradient monitors.
The dashboard is a very powerful tool, and it is designed to give you easy access to your monitor’s data, enabling you to explore, analyse and share information. You can also configure how exactly your monitor works to ensure that it’s in the optimum configuration for your use case.
{{< blog-highlight-shortcode title="Key Highlight" >}} This guide discusses every dashboard feature in detail. If you’ve just set up your monitor and are looking for the first steps to take on the dashboard, please refer to Chapter S6 - Configuring Your Dashboard which covers the most important dashboard features for new users. {{< /blog-highlight-shortcode >}}
1. The Navigation Panel
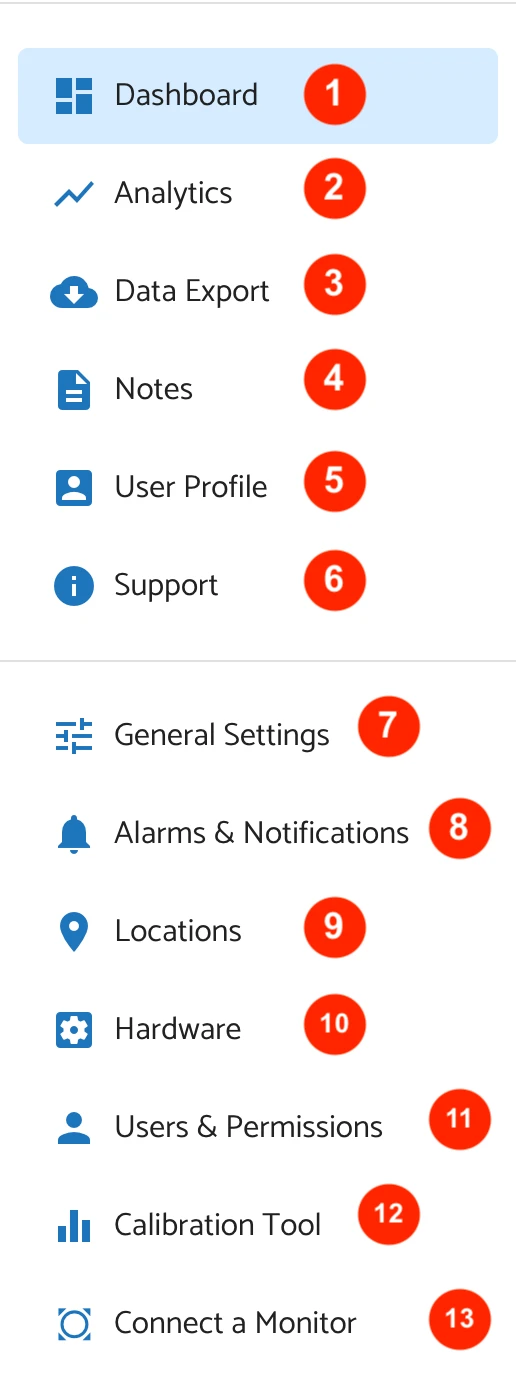
By pressing the three-line menu on the top left, you access the side navigation menu. This menu is where you will navigate between pages on the AirGradient dashboard and it’s under this menu that you will find most of the settings for your monitor.Once you click on this menu, you will be presented with a list of all the pages on the dashboard you can navigate to. Below is an image with explainers for the basic functionality of each page.
Please note: If you can’t see all of these pages or the sub-pages (which we will discuss soon), it’s likely that you don’t have the permissions required to access them. If this is the case, please contact your dashboard administrator to update your permissions.
What does the navigation panel include?
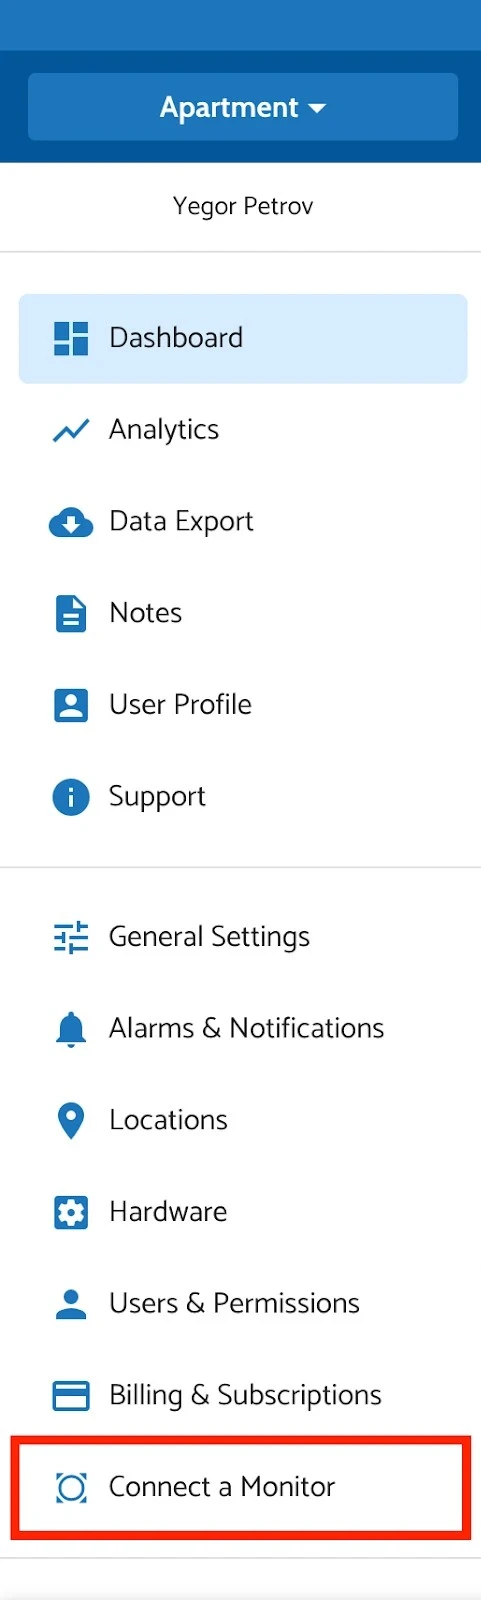
Here’s a short description of each section in the AirGradient Dashboard side navigation panel:
- Dashboard – The main overview of air quality data, showing key metrics like PM2.5, CO2, temperature, and humidity. This is the home page of the dashboard, and likely the page you are already on.
- Analytics – Provides deeper insights and trends over time for different air quality parameters.
- Data Export – Allows users to download air quality data for further analysis.
- Notes – table of notes related to air quality monitoring created by you.
- User Profile – Personal settings, preferences, and account management options.
- Support – Access to help articles, troubleshooting guides, and customer support.
- General Settings – Configuration options for customizing the platform’s behaviour and preferences.
- Alarms & Notifications – Set up and manage alerts for specific air quality thresholds.
- Locations – Manage different monitoring locations and view their air quality data.
- Hardware – Displays information about connected sensors and devices.
- Users & Permissions – Manage user roles, permissions, and access control.
- Calibration Tool - Calibrate your monitor for further accuracy.
- Connect a Monitor – Add new air quality monitoring devices to the platform.
1.1 The Dashboard
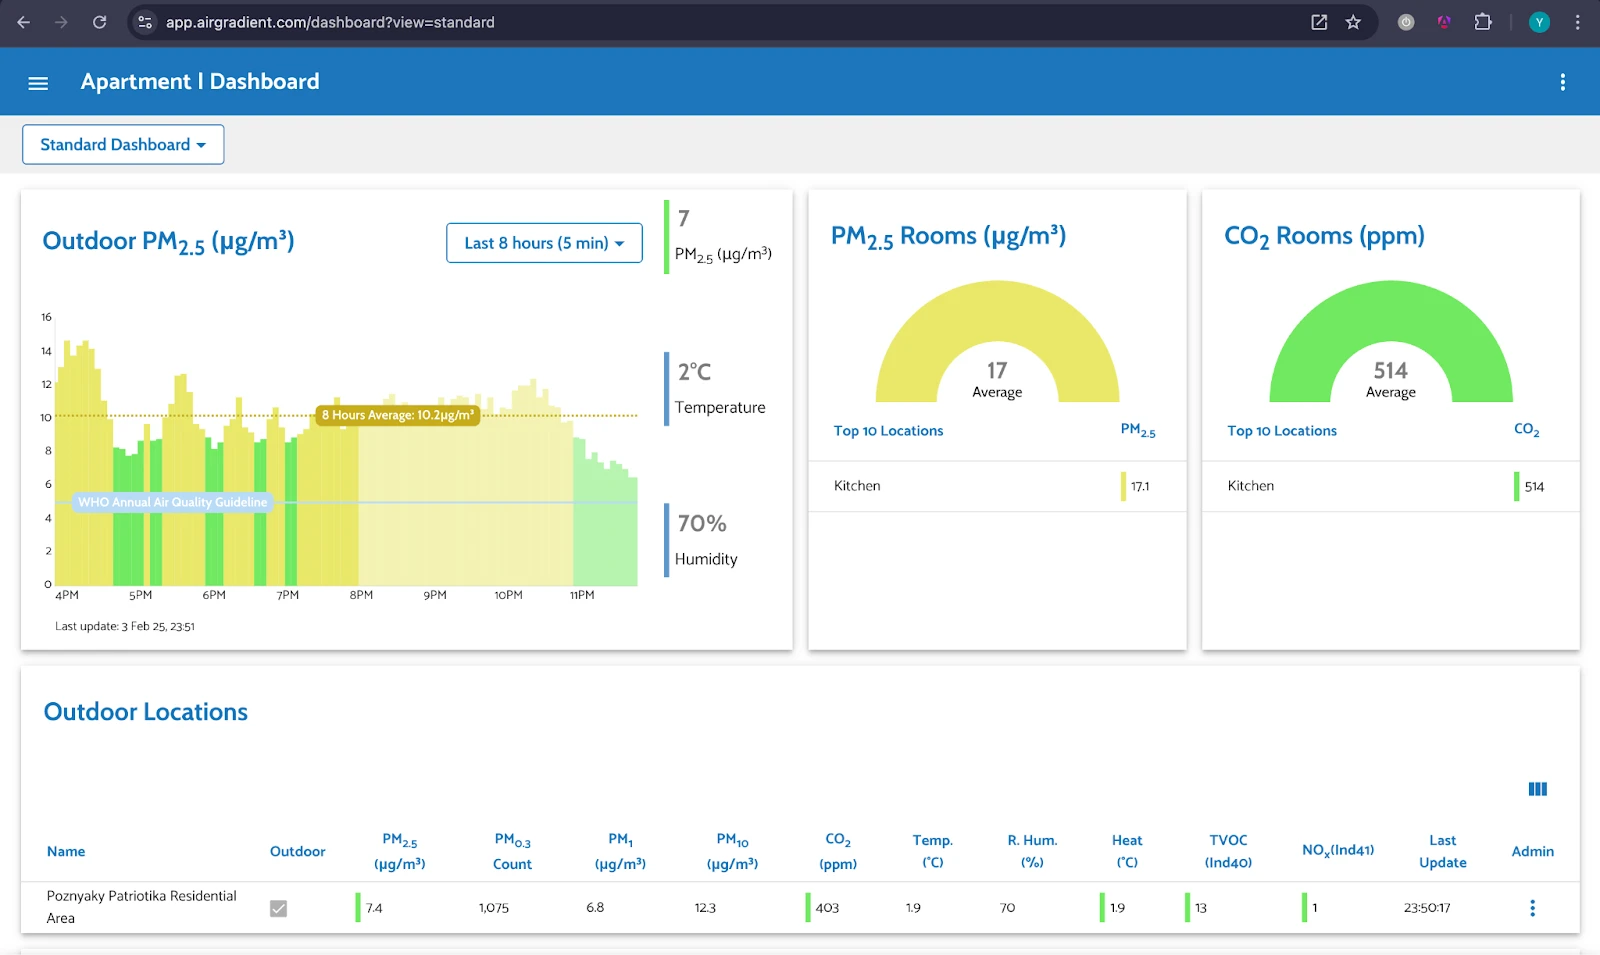
Figure 3: The Dashboard
The Dashboard page allows you to view all the information collected from your monitors, presented in charts and tables. There are two main types of dashboard layouts: Standard and Custom.
- Standard: The recommended view by AirGradient.
- Custom: Allows you to personalize your dashboard by selecting specific measures and locations.
You’ll find a more detailed explanation about both dashboard layouts below.
1.2 Analytics Page
Link: https://app.airgradient.com/dashboard/analytics
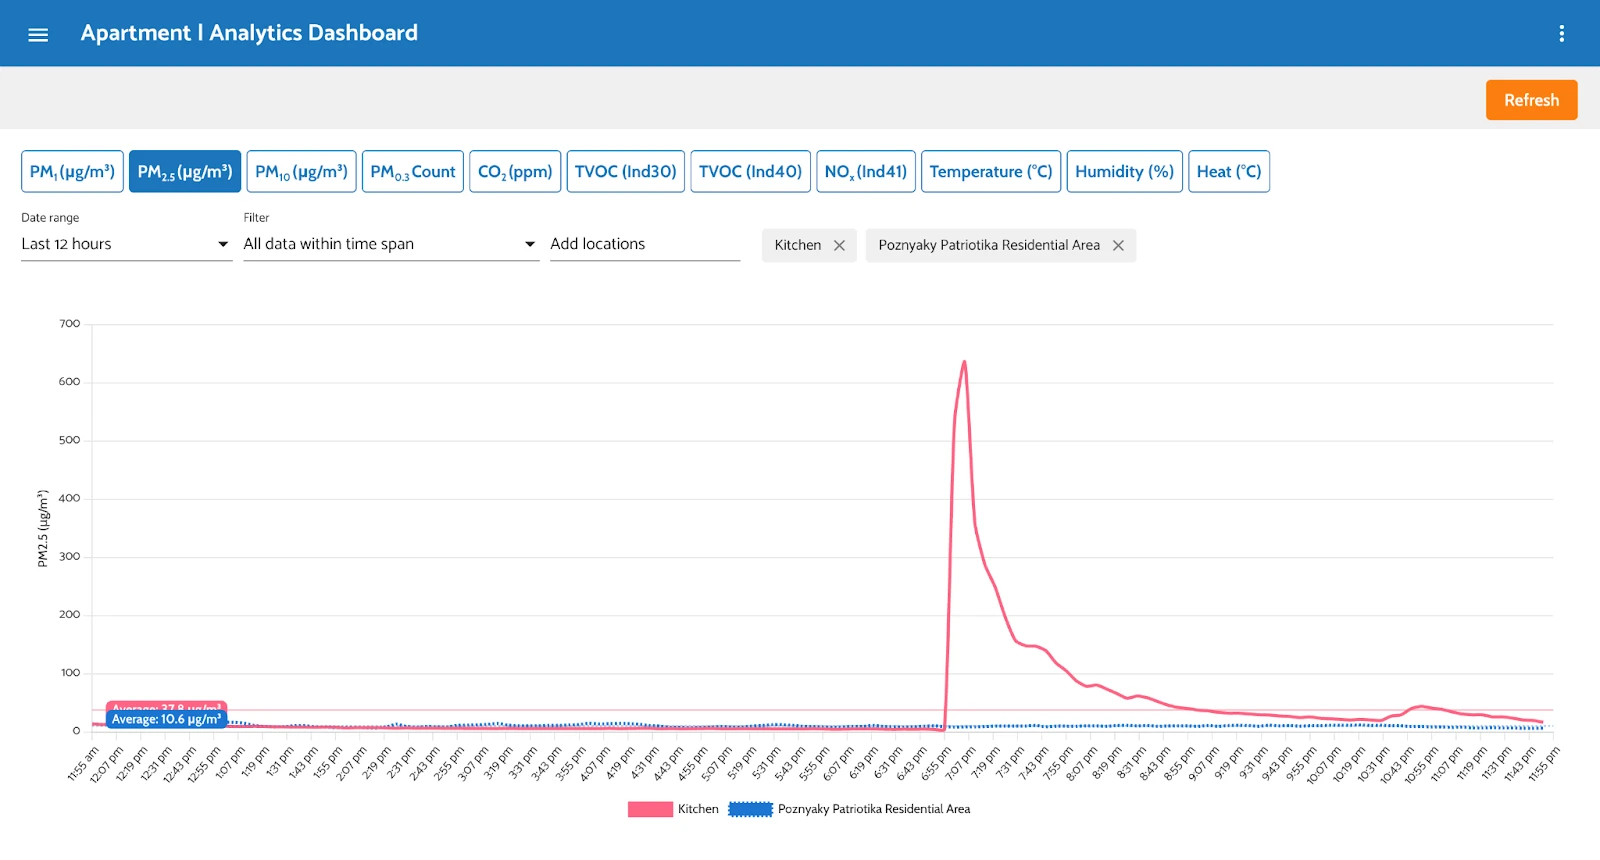
Analyze and compare your locations' data for specific measures over different time periods. You can select locations, time frames, and the desired measure for comparison.
The blue boxes along the top of the screen allow you to choose which pollutants to graph. Underneath this, you can select the data range (please keep in mind that free dashboard accounts have limited historical data), filter, and the monitors you want to graph. You can add multiple monitors, including different types of monitors (for example, you can graph the PM2.5 readings from an Open Air Max and Open Air Cellular on the same graph).
This page allows you to quickly and easily identify trends in your air quality. However, if you want to carry out more advanced analysis, we recommend exporting the data.
Important note: on the dashboard, you can only graph one pollutant at a time. If you want to compare trends across pollutants, please visit the data export page (discussed below) and export your data for comparison.
1.3 Export Data Page
Link: https://app.airgradient.com/dashboard/export
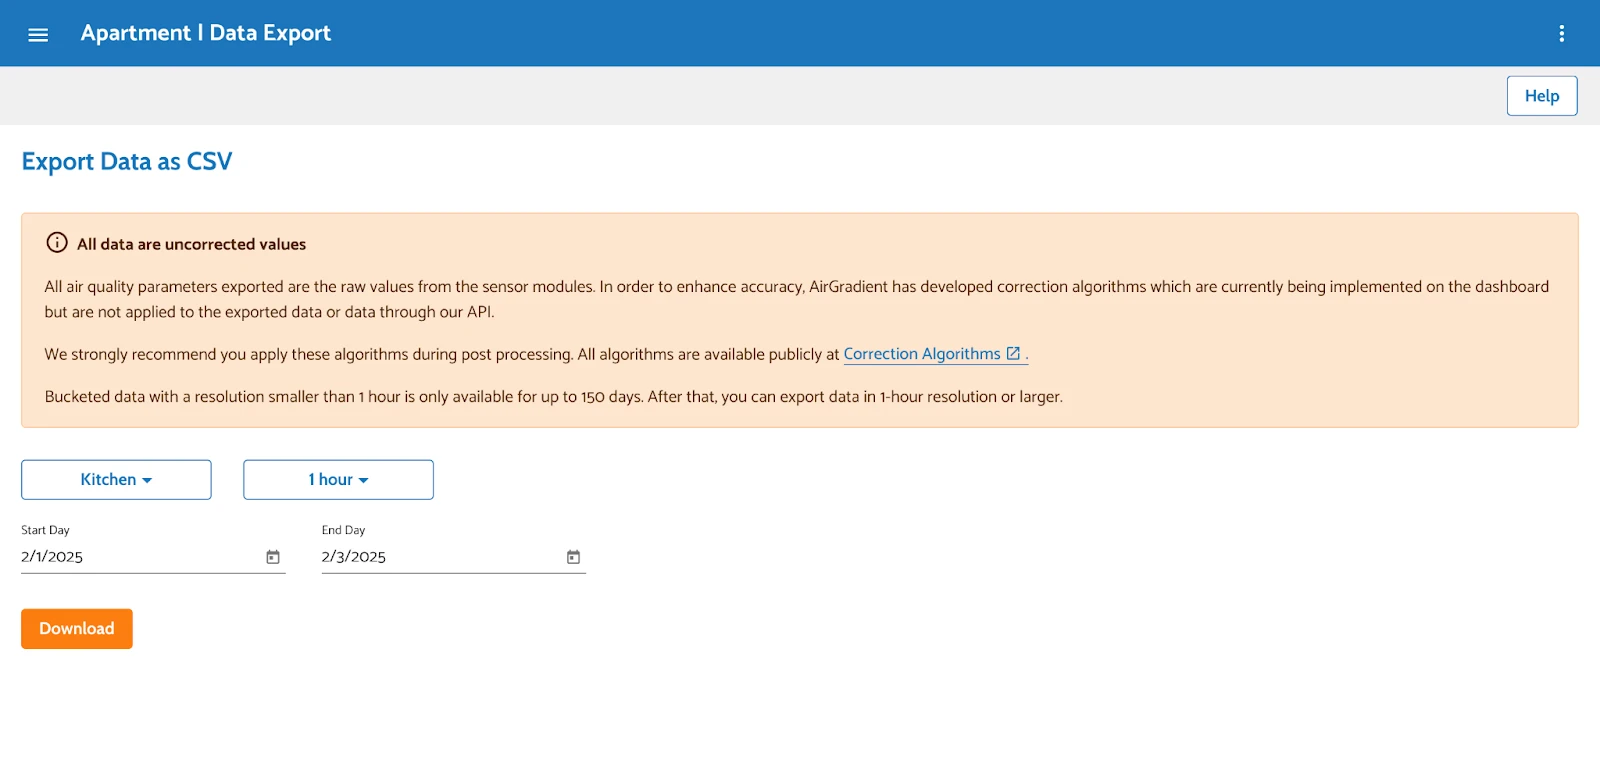
This page lets you export data in table format (excel format) for a specific period and measure.
To export data, you will need to select the location (monitor) that you want to export data from, the bucket (the averaging period) and the start and end date of the exported data. Please note that raw data is only kept for 10 days.
Once you click ‘Download’ a CSV file will be generated and downloaded through your browser. Please allow this download, and save it in a location that is easy to relocate.
1.4 Notes Page
Link: https://app.airgradient.com/dashboard/notes
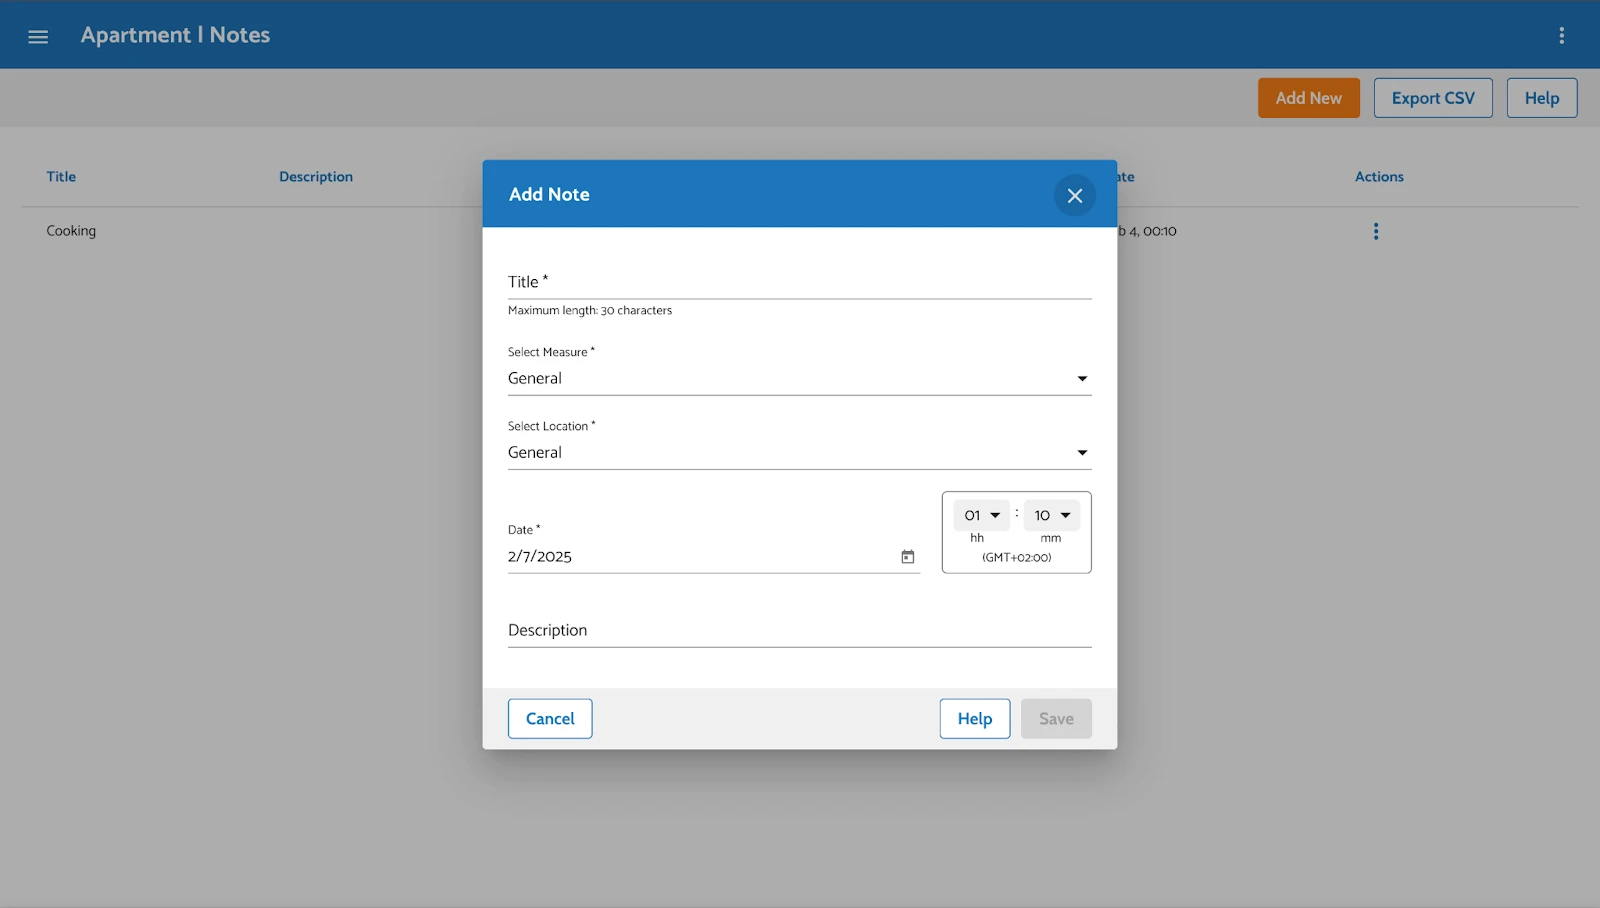
Notes allow you to mark events that might be significant for your historical air quality data. You can link each note to a specific air quality measurement and location or make them general, meaning they will be visible across all measurements and locations. By pressing ‘Add New,’ you will open a modal window where you can create a note.
If you would like to export your notes and the associated timestamps, you can select ‘Export CSV’ in the top-right corner.
Please note that you can also add a note directly on the chart by pressing on the data bar on the dashboard homescreen.
1.5 User Profile Page
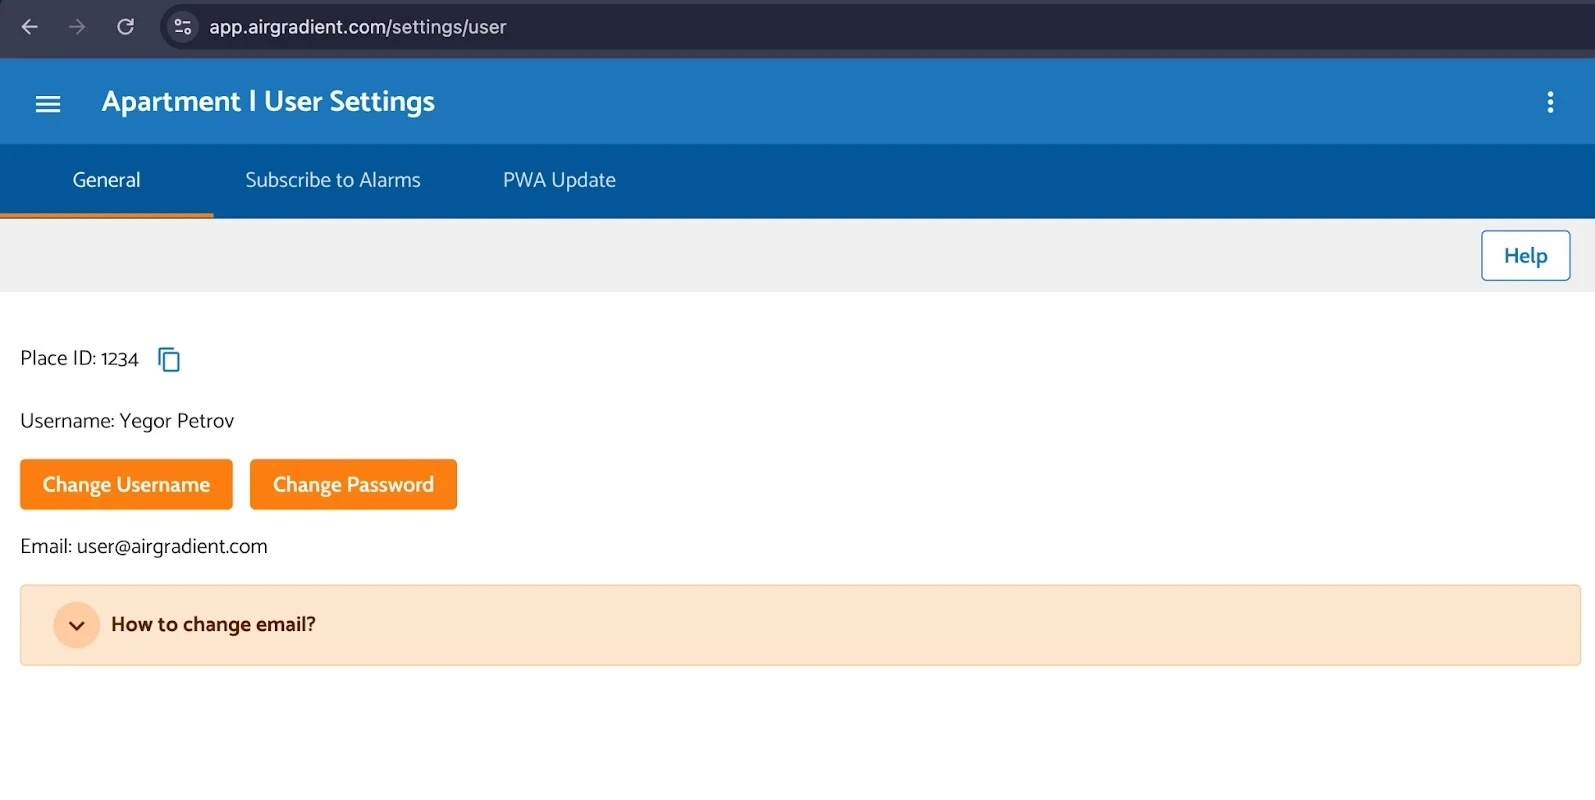
Link: https://app.airgradient.com/settings/user
Here you can update your profile, set a nickname, or change your email and password. At the top of the page, there are also tabs to subscribe to monitor alarms (these must first be set up on the Alarms & Notifications page) and update the PWA (progressive web app) if you’ve saved the dashboard to the home screen of your iOS device.
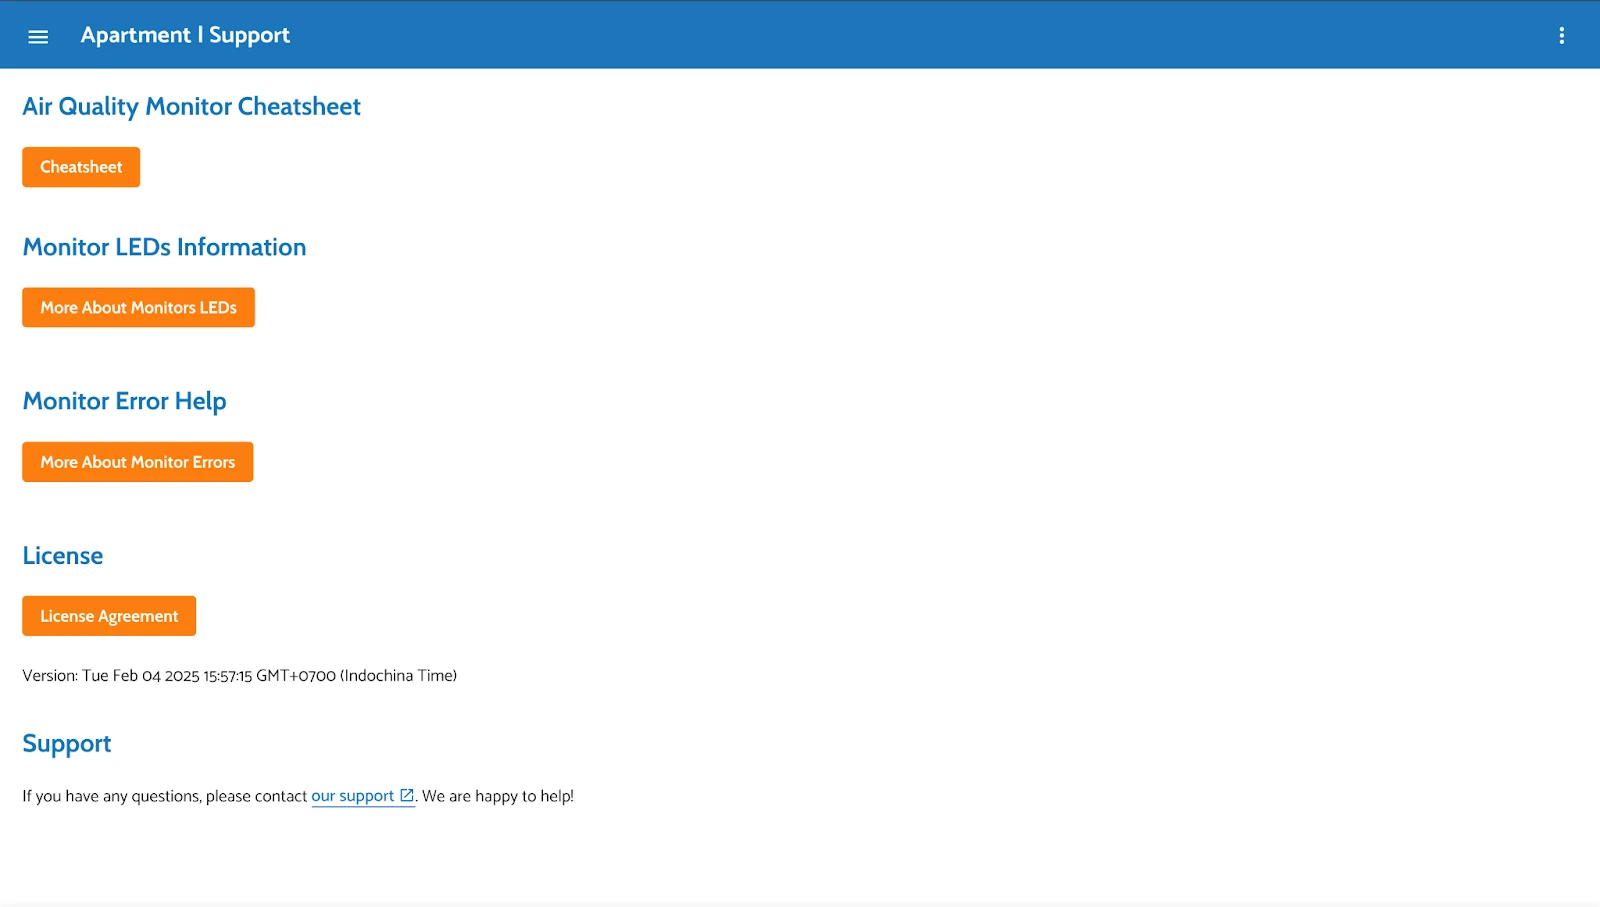
1.6 Support Page
If you would like some help or just want to learn more, you can do so anytime by going to the Support page.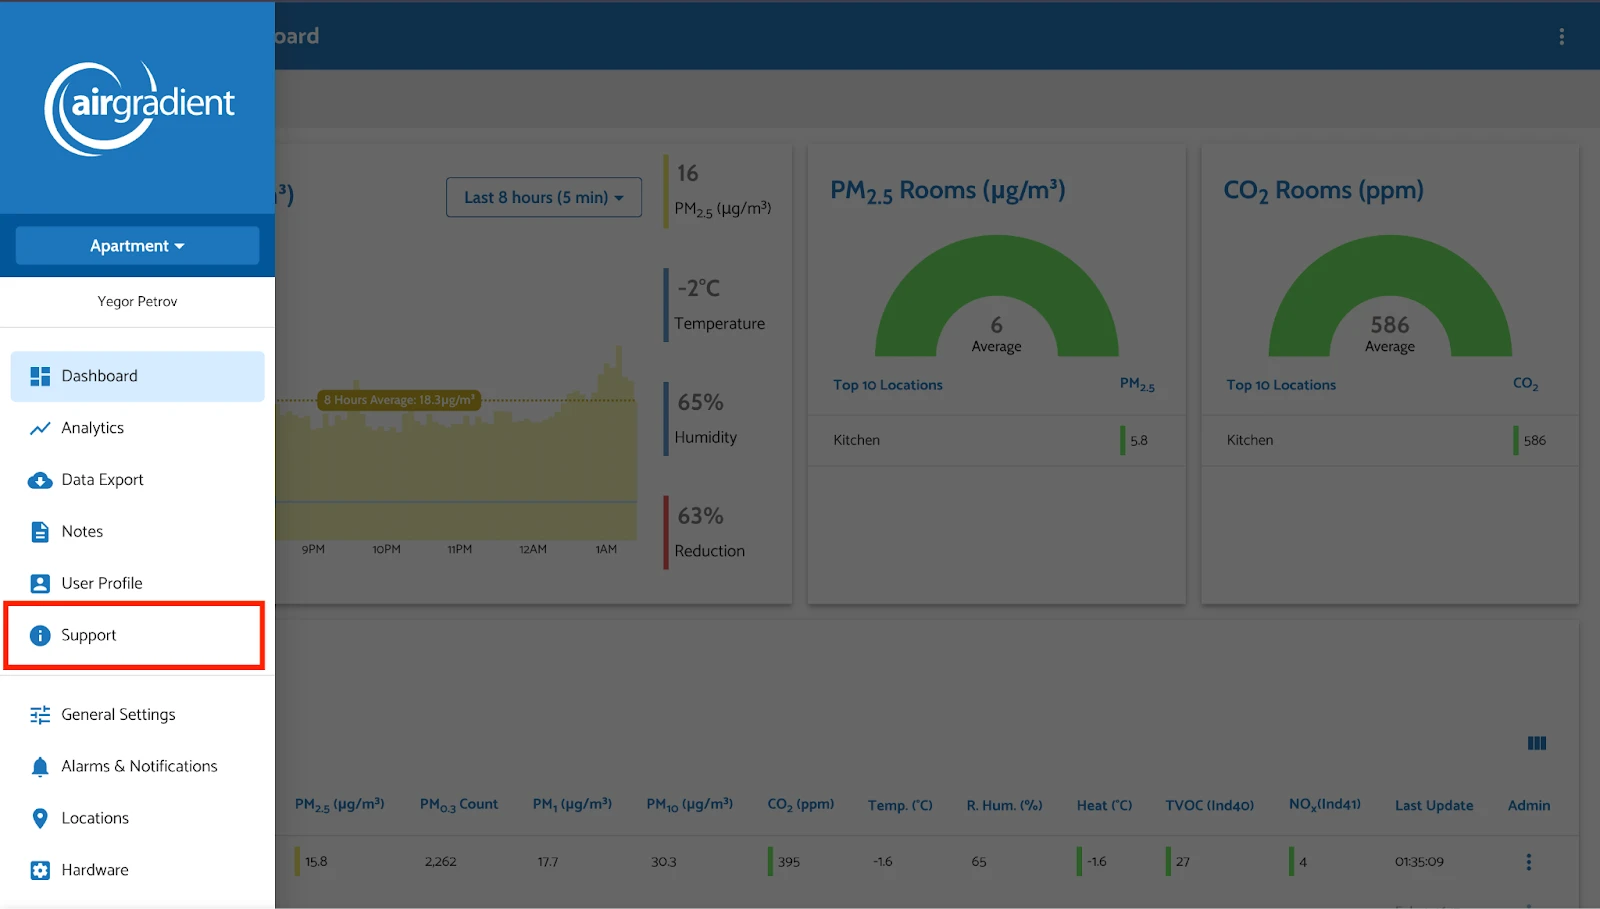
After pressing you appear on our support page:
1.7 General Settings
Link: [https://app.airgradient.com/settings/place](https://app.airgradient.com/settings/place)In General Settings, you have many different tabs which house most of the dashboard and monitor settings.
Let's go through each one:
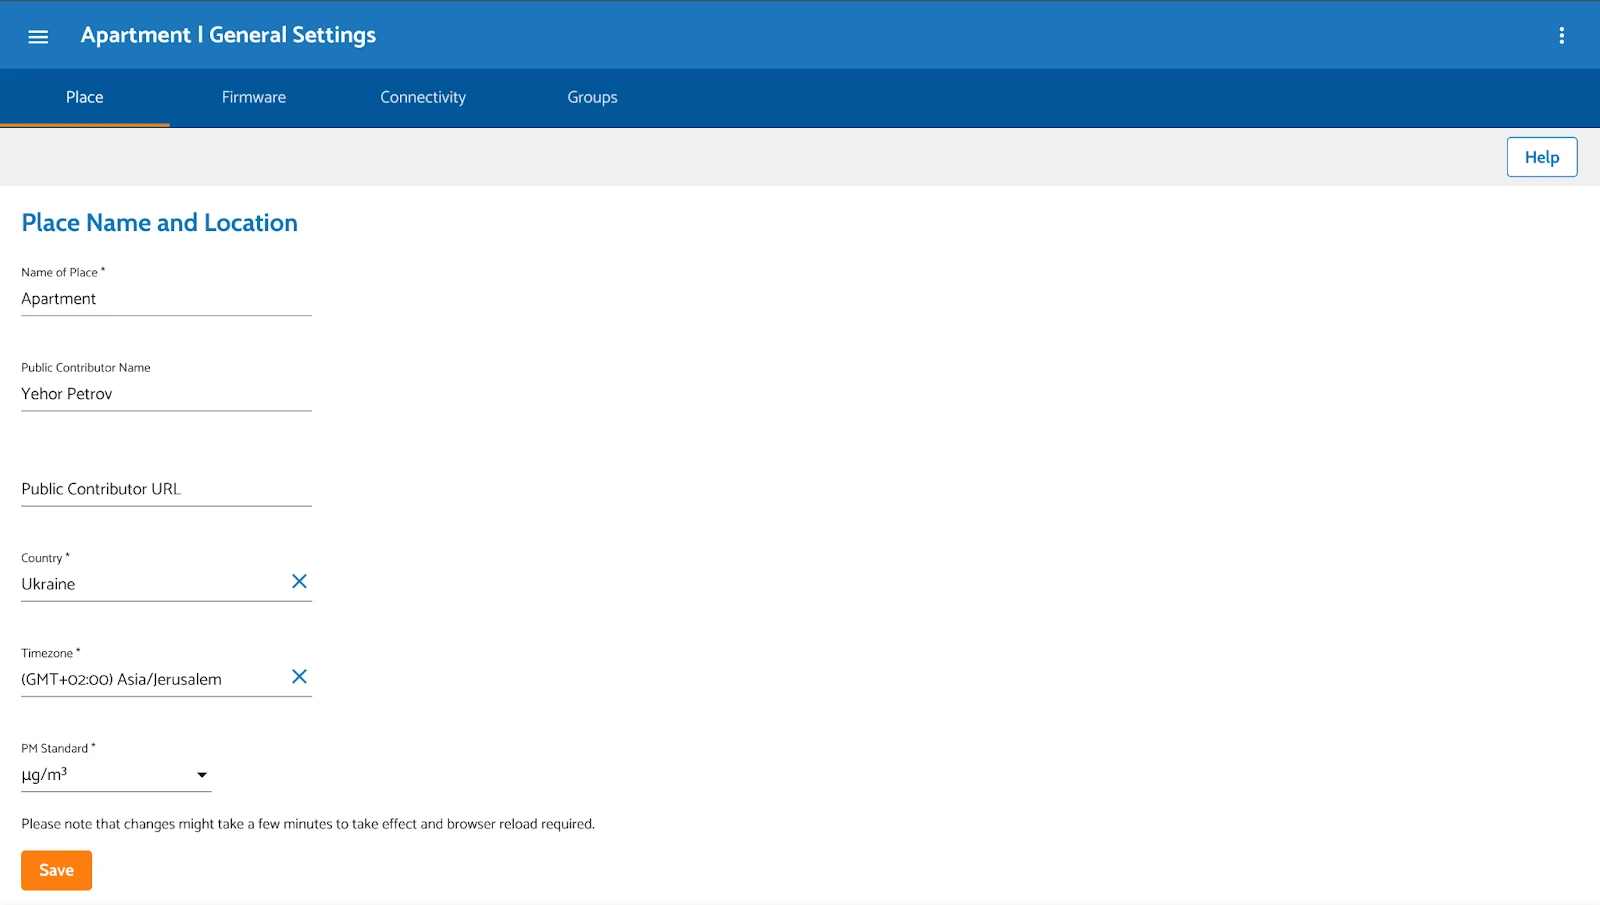
Place
Link: https://app.airgradient.com/settings/place?tab=0
You can configure place settings such as the place name, public contributor name, public contributor URL, temperature measurement unit, timezone, and country. You can also set the PM standard for the entire place.
Place Name - the name of your place for where you’ve installed the
Public Contributor Name - will be provided to all 3rd parties you share data with and is then often displayed together with the air quality data you share on their application. It can be your personal name or the name of the organisation / company that owns the monitor. You can also leave the Public Contributor Name empty in case you do not wish to be named.
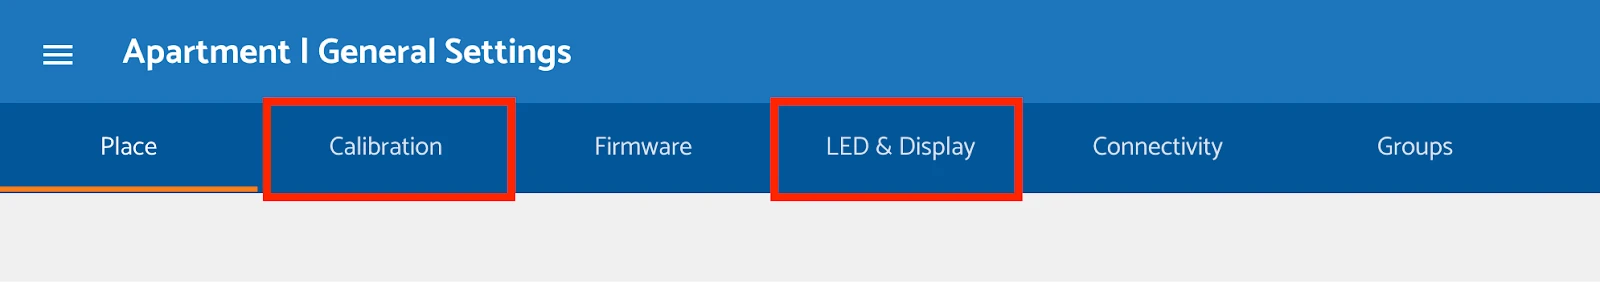
Additionally, you can enable Advanced Configuration, which adds two extra tabs:
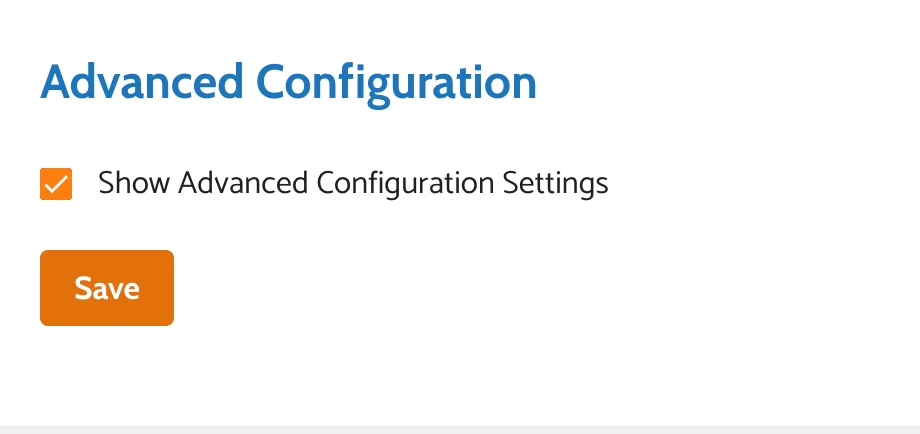
- Calibration – Configure calibration parameters for such measures as PM2.5, Relative Humidity and temperature.
- LED & Display – Adjust LED lights and display settings, such as brightness and day/night modes. This applies to the AirGradient ONE (indoor air quality monitor) and doesn’t need to be used if you are only relying on outdoor air quality monitors.
Most of the time, you won’t need this. However, if you want to create a default configuration that serves as a standard for each monitor in your place, you should enable Advanced Configuration.
Firmware
Link: https://app.airgradient.com/settings/place?tab=1
You can configure the firmware version for your place or choose to automatically update to the latest firmware version.
Connectivity
Link: https://app.airgradient.com/settings/place?tab=2
Manage the MQTT broker and API access. AirGradient monitors can send the data not only to the AirGradient Cloud but also to a local or remote MQTT broker. MQTT (Message Queuing Telemetry Transport) is a lightweight messaging protocol that helps devices communicate efficiently, even on slow or unreliable networks. It's commonly used in IoT applications.
{{< blog-highlight-shortcode title="Learn More" >}} Learn more on MQTT visit the guidelines Here you can form an API key to access to AirGradient API: https://api.airgradient.com/public/docs/api/v1/ {{< /blog-highlight-shortcode >}}
Groups
Link: https://app.airgradient.com/settings/place?tab=3
Larger organizations, such as schools or companies, may need to separate different sections in the AirGradient dashboard and reports. To facilitate this, you can set up different Groups.
1.8 Alarms & Notifications
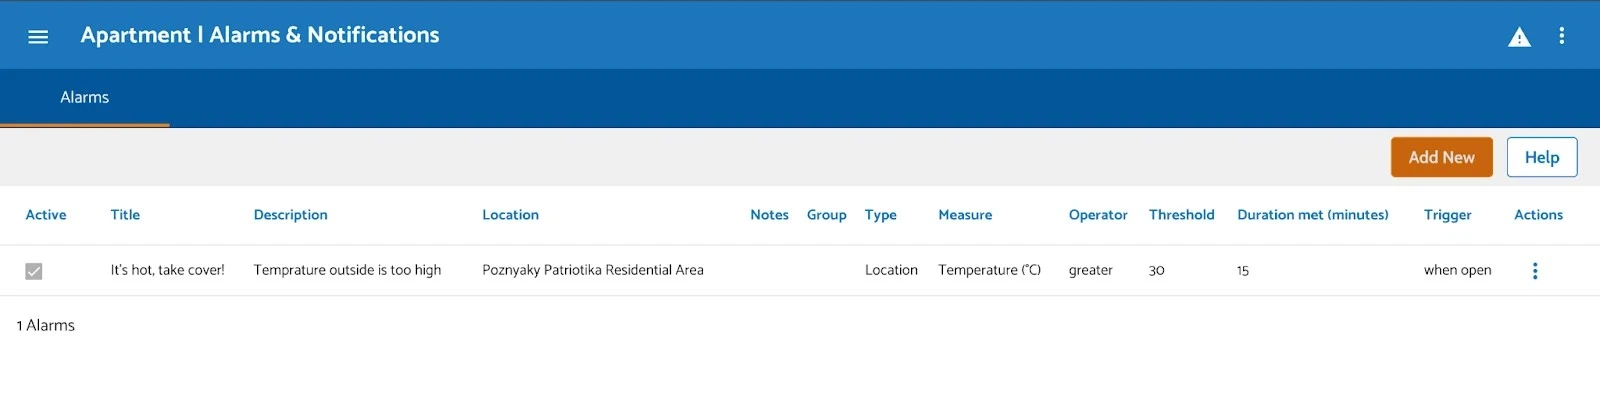
Alarms on the AirGradient Dashboard are alerts or notifications triggered when air quality measurements exceed predefined thresholds or meet specific conditions. They help users monitor and respond to significant changes in air quality, such as:
- High levels of pollutants (e.g., PM2.5, PM10, CO2, VOCs)
- Temperature or humidity beyond comfortable ranges
- Custom-defined alerts based on user settings for specific air quality metrics.
These alarms can be configured to display prominently on the dashboard and may also send notifications via email or other channels, depending on the system setup. Their purpose is to ensure prompt action when air quality reaches unhealthy or concerning levels.
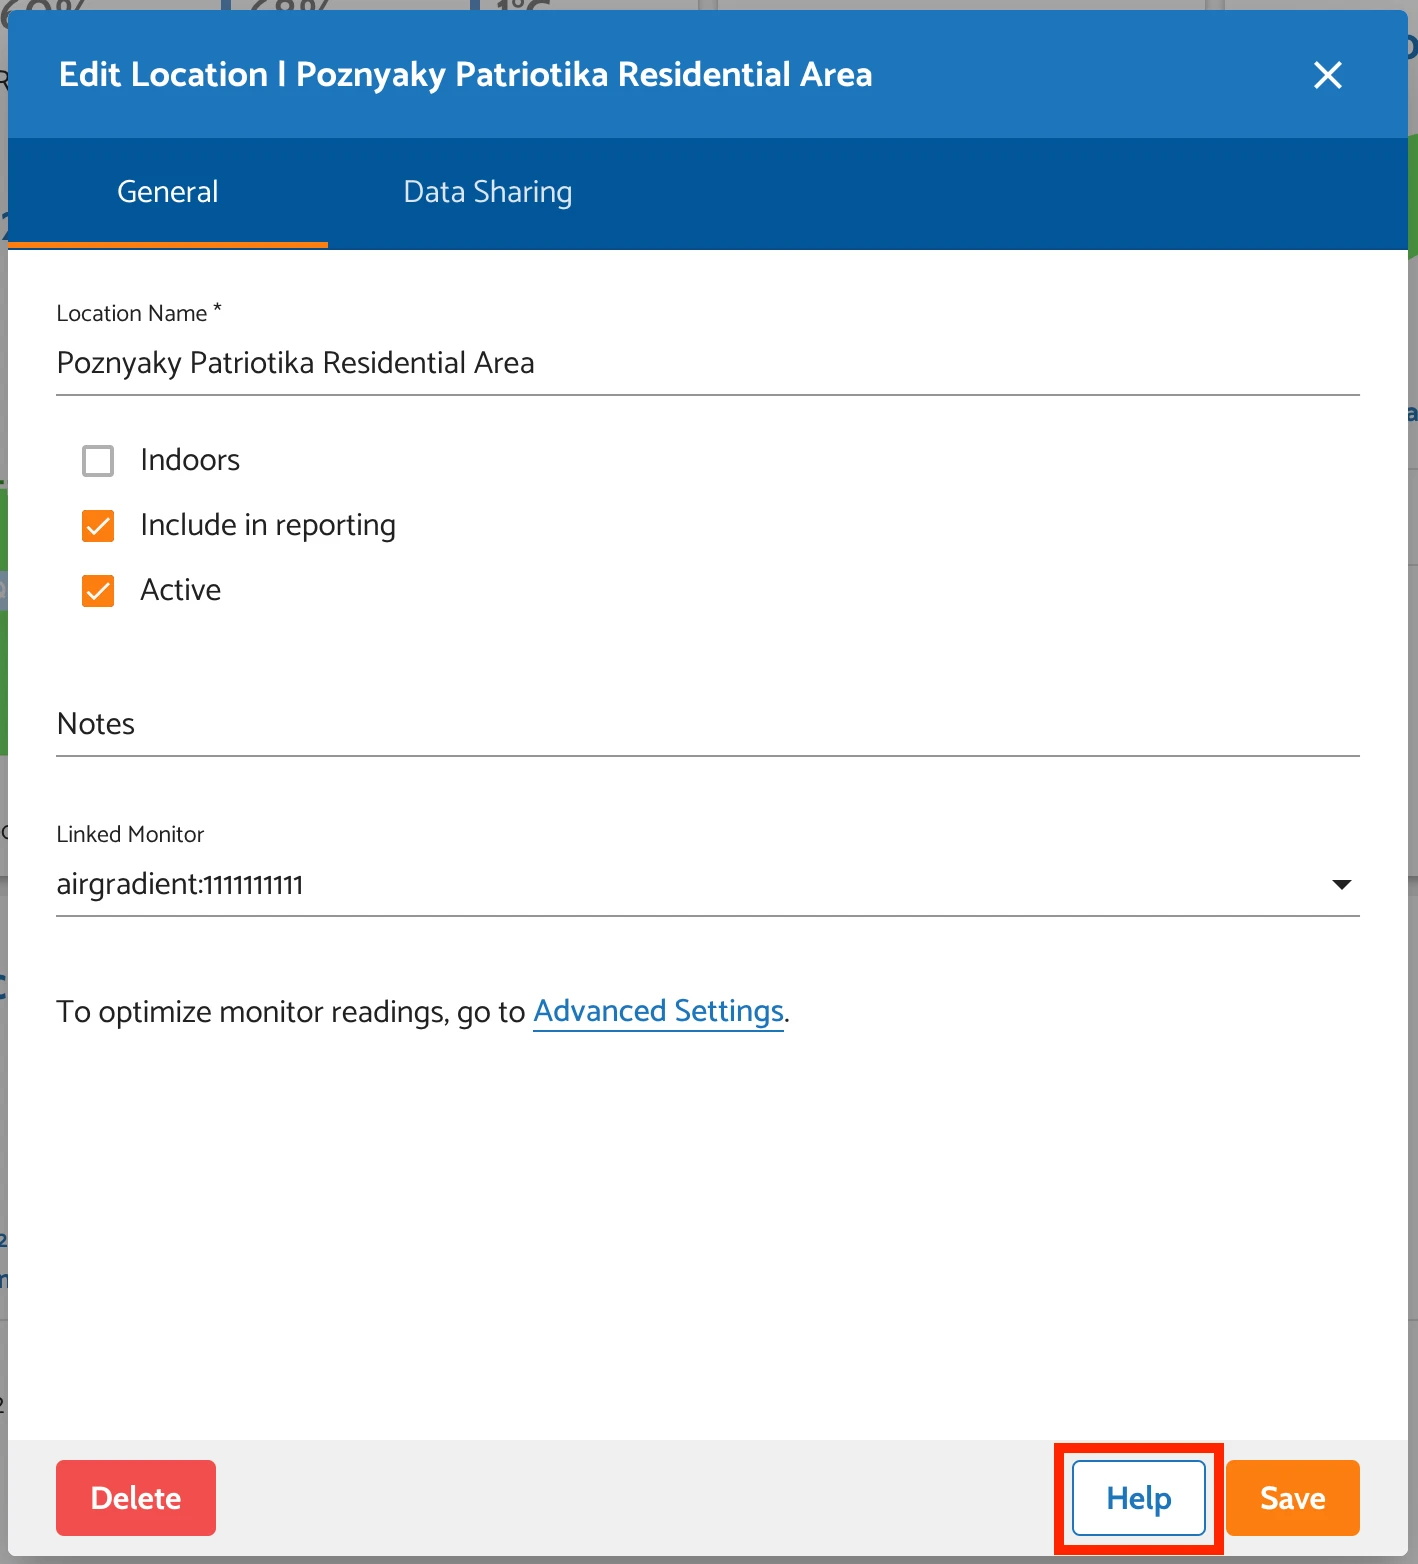
1.9 Locations
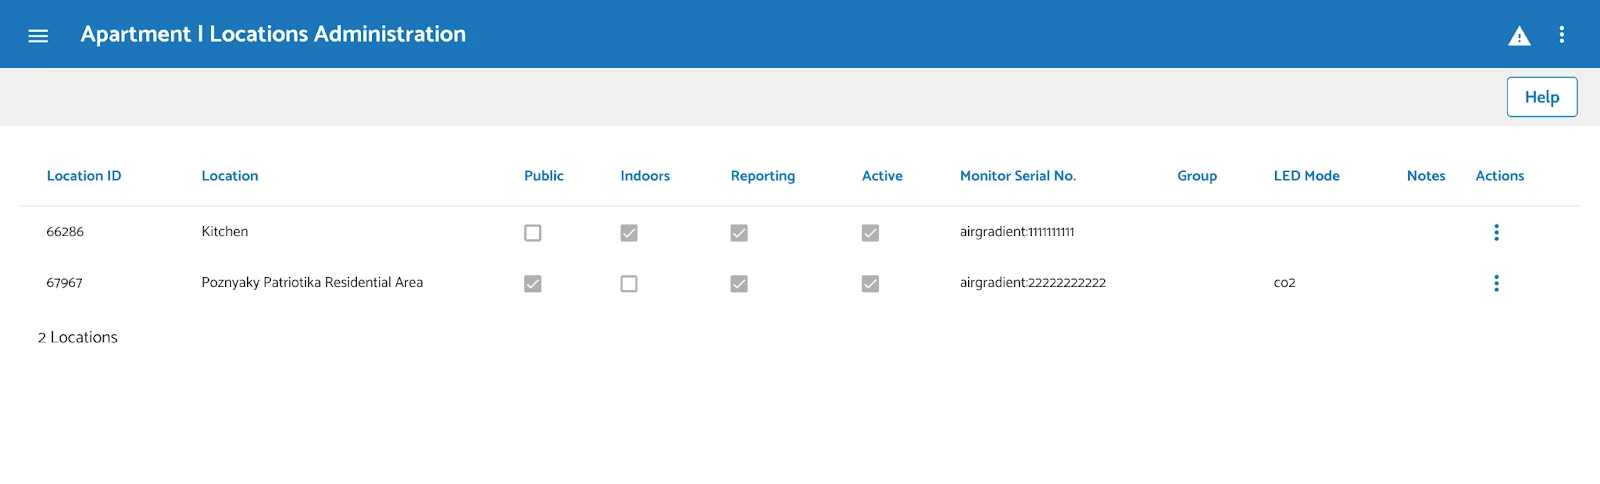
Locations is a feature that allows users to manage and organize the physical locations associated with their air quality monitors. It provides tools for better structuring and monitoring air quality data across different areas. A location can be a room, a common area or an outside location. You can attach a monitor to a location, as well as detach it. This allows you to e.g. change a monitor if you need to replace an existing one.
1.10 Hardware
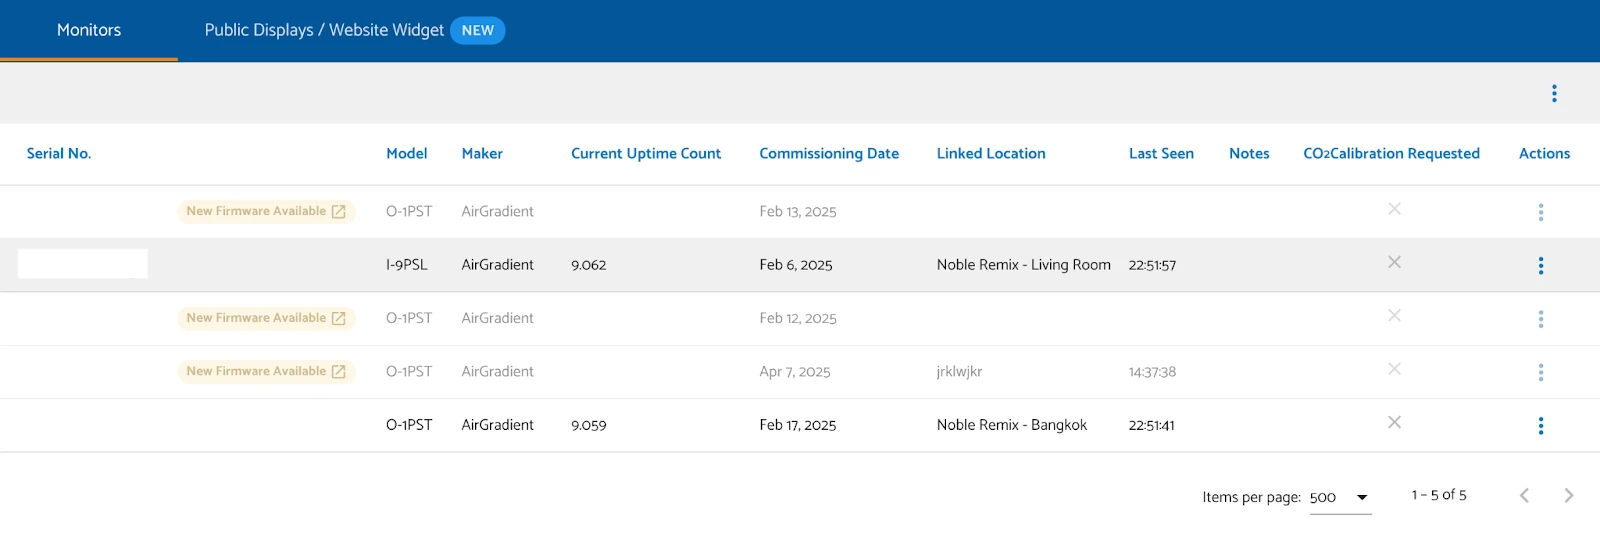
Hardware refers to the section where users can manage, configure, and monitor their air quality hardware devices. This feature helps ensure that the connected sensors and monitoring devices function correctly and are efficiently organized. Here you can see all monitors assigned to your location, including third-party monitors. The existing monitors can be edited or deleted here.
Under the Public Displays/Website Widget tab on the hardware page, you are also able to create displays that can be seen or shared through a unique URL. You can select which monitors to show data from, and which parameters you want to display, and you can also customize exactly how the display appears. Once completed, you will be given a URL that can be visited or seen by the public. This is a great way to share the current air quality without giving users access to your dashboard.
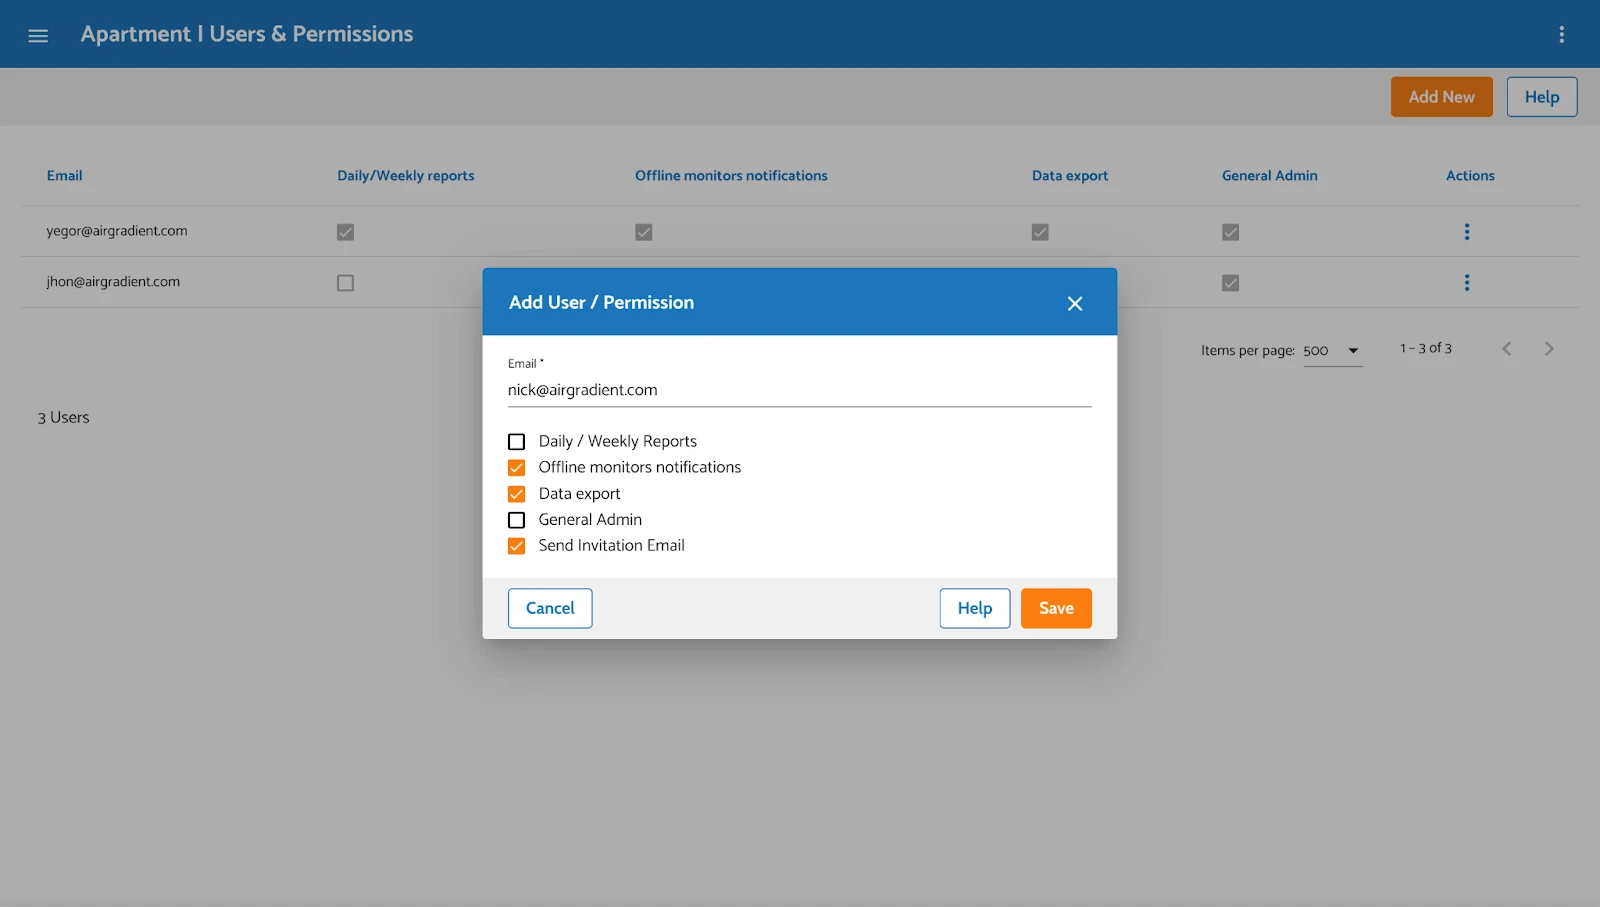
1.11 Users & Permissions
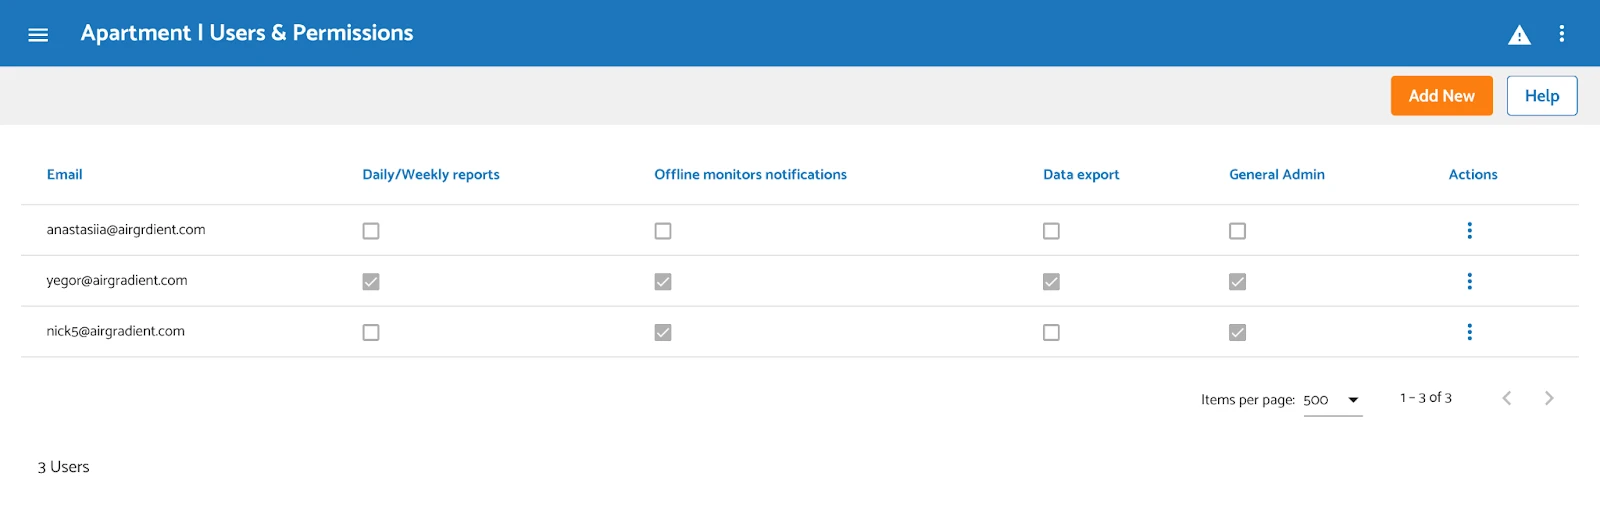
Here, you can define users and their permissions for the place. Users can be added, deleted, or edited.
When adding new users, you can select exactly what permissions they get and what features they can access. It’s important to note that, depending on what permissions you give each user, they may not be able to access certain parts of the dashboard.
You can also send an email to any new users who are added to the dashboard, allowing them to quickly access the dashboard they now have access to.
1.12 Calibration Tool
This tab allows you to calibrate the the particulate matter readings of your monitor versus either another Airgradient monitor, or compared to a nearby reference monitor. For a full guide on this section, please refer to [S8: Monitor Calibration](/professional/cities/undp-toolkit/setup/calibration).1.13 Connect a Monitor
The "Connect a Monitor" function in the AirGradient app allows you to link your air quality monitor with the AirGradient Dashboard, enabling real-time data tracking, analysis, and alerts. This connection makes it easy to monitor indoor environmental conditions and ensure healthier air quality. For steps to connect your monitor to the dashboard, you may go through [S3: Connecting to the Dashboard](/professional/cities/undp-toolkit/setup/dashboard-connection).2. Additional Tabs
We have additional tabs to enhance your experience using the dashboard.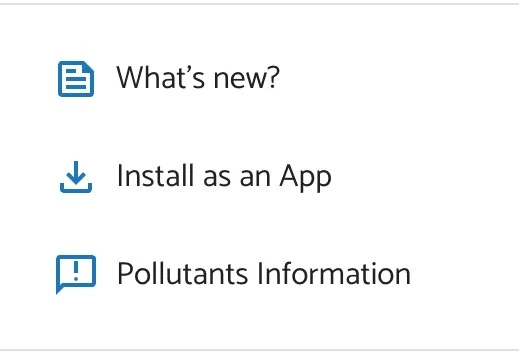
Let’s go through each of them:
1. What’s New? - This tab keeps you updated on the latest dashboard updates and releases. We'll regularly update it so you can always stay informed.
2. Install as an App - You can install our dashboard on your device with just one click! Simply tap this option to add it to your home screen and enjoy quick access to your dashboard.
3. Pollutants Information - Here, you can learn about pollutants, their harmful effects, and ways to combat them!
3. Standard and Custom Dashboard Layout
AirGradient’s dashboards are designed to give users clear, actionable insights into air quality. Whether you prefer a ready-to-go overview or a fully tailored experience, the platform provides flexible options to meet your needs.The Standard Dashboard View offers a comprehensive snapshot of key air quality indicators across all monitored locations, while the Custom Dashboard View empowers users to drill into specific data points by selecting locations, time ranges, and even adjusting monitor settings. Together, these dashboards provide both at-a-glance clarity and in-depth analysis, ensuring you stay informed and in control.
3.1 Standard Dashboard View
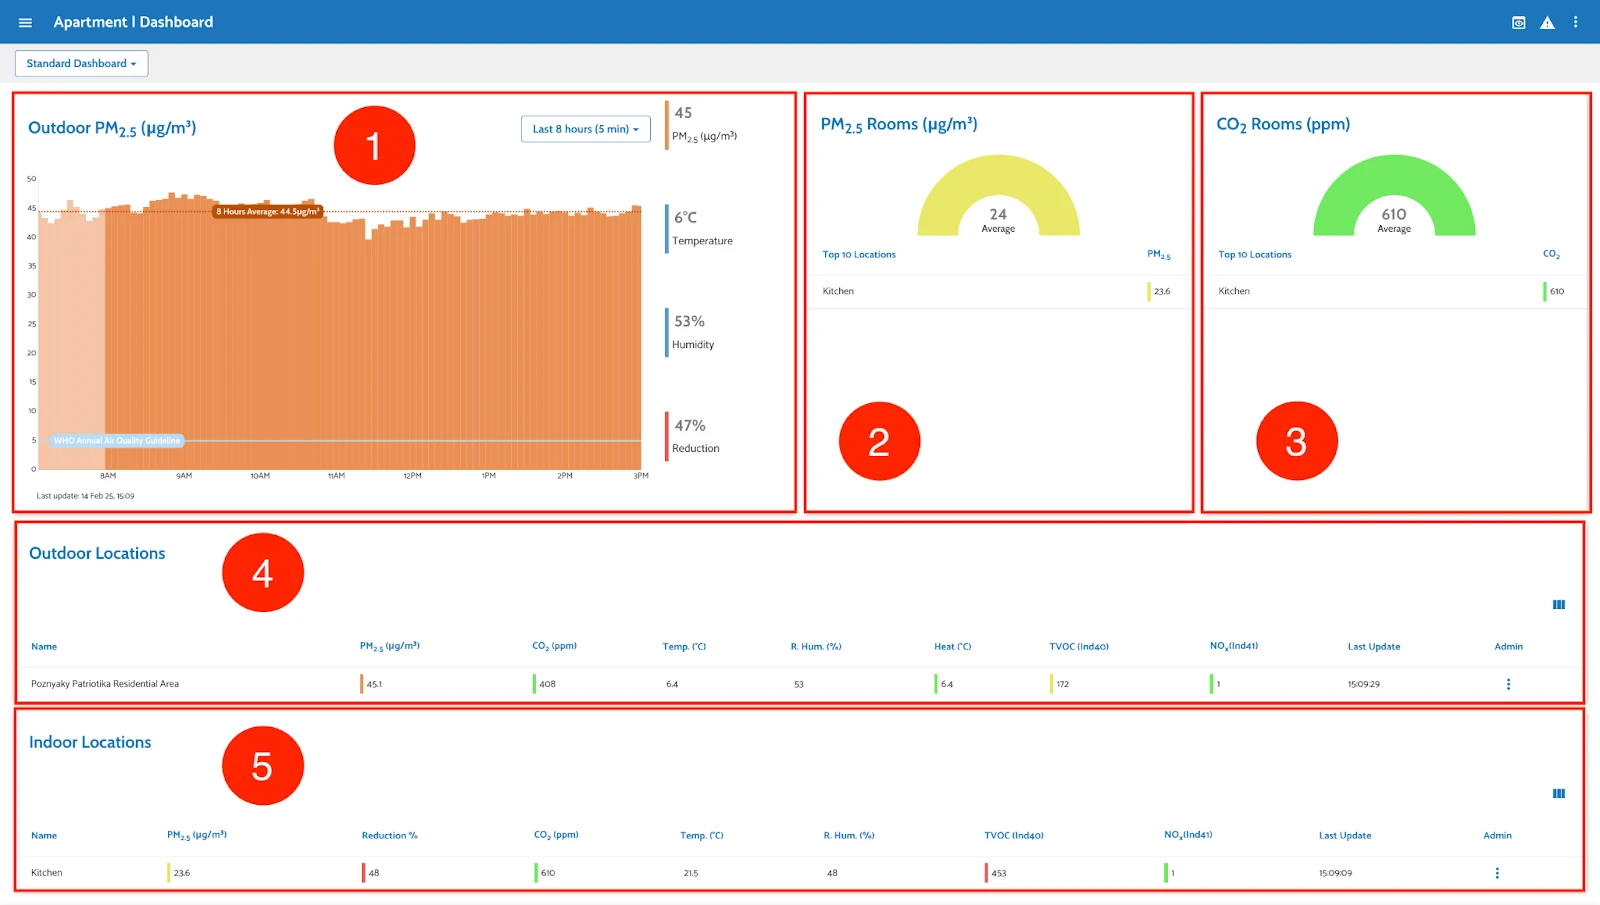
Here’s a quick overview of what we have on the AirGradient dashboard based on the image and general information about AirGradient's platform:
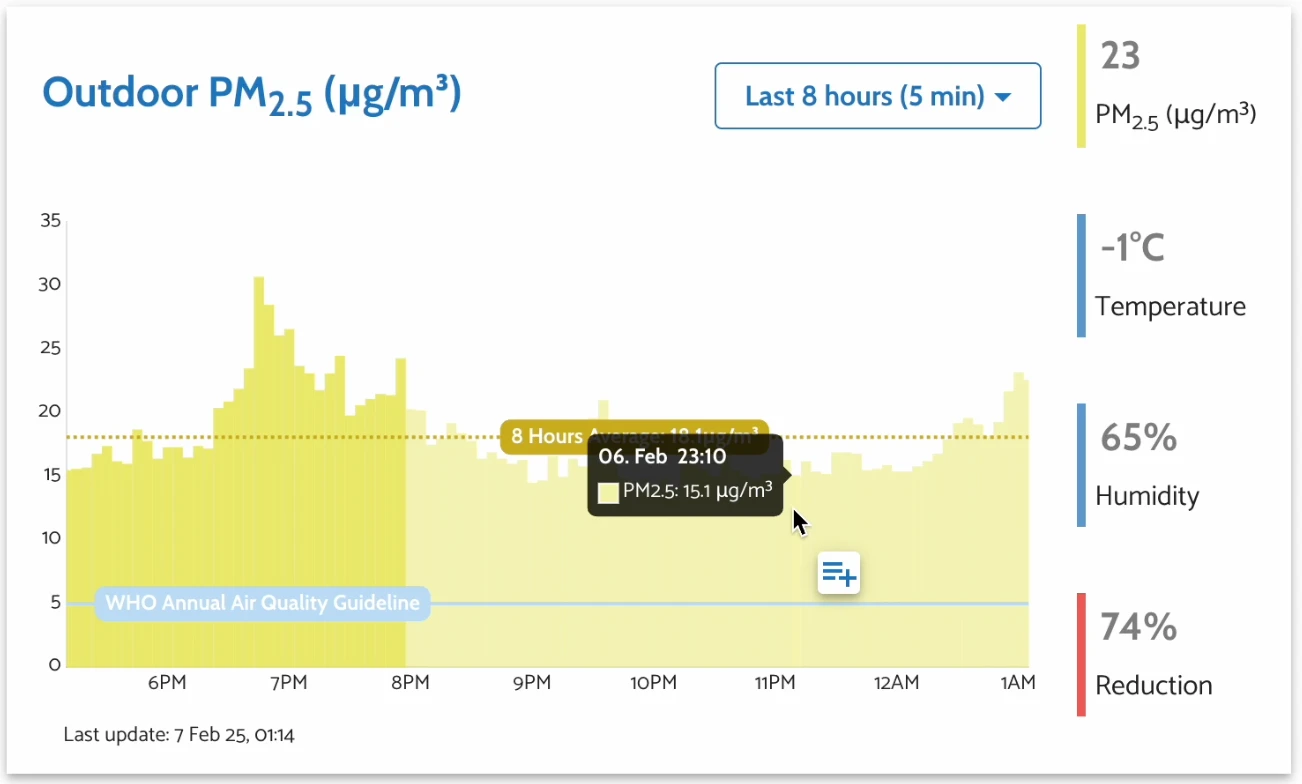
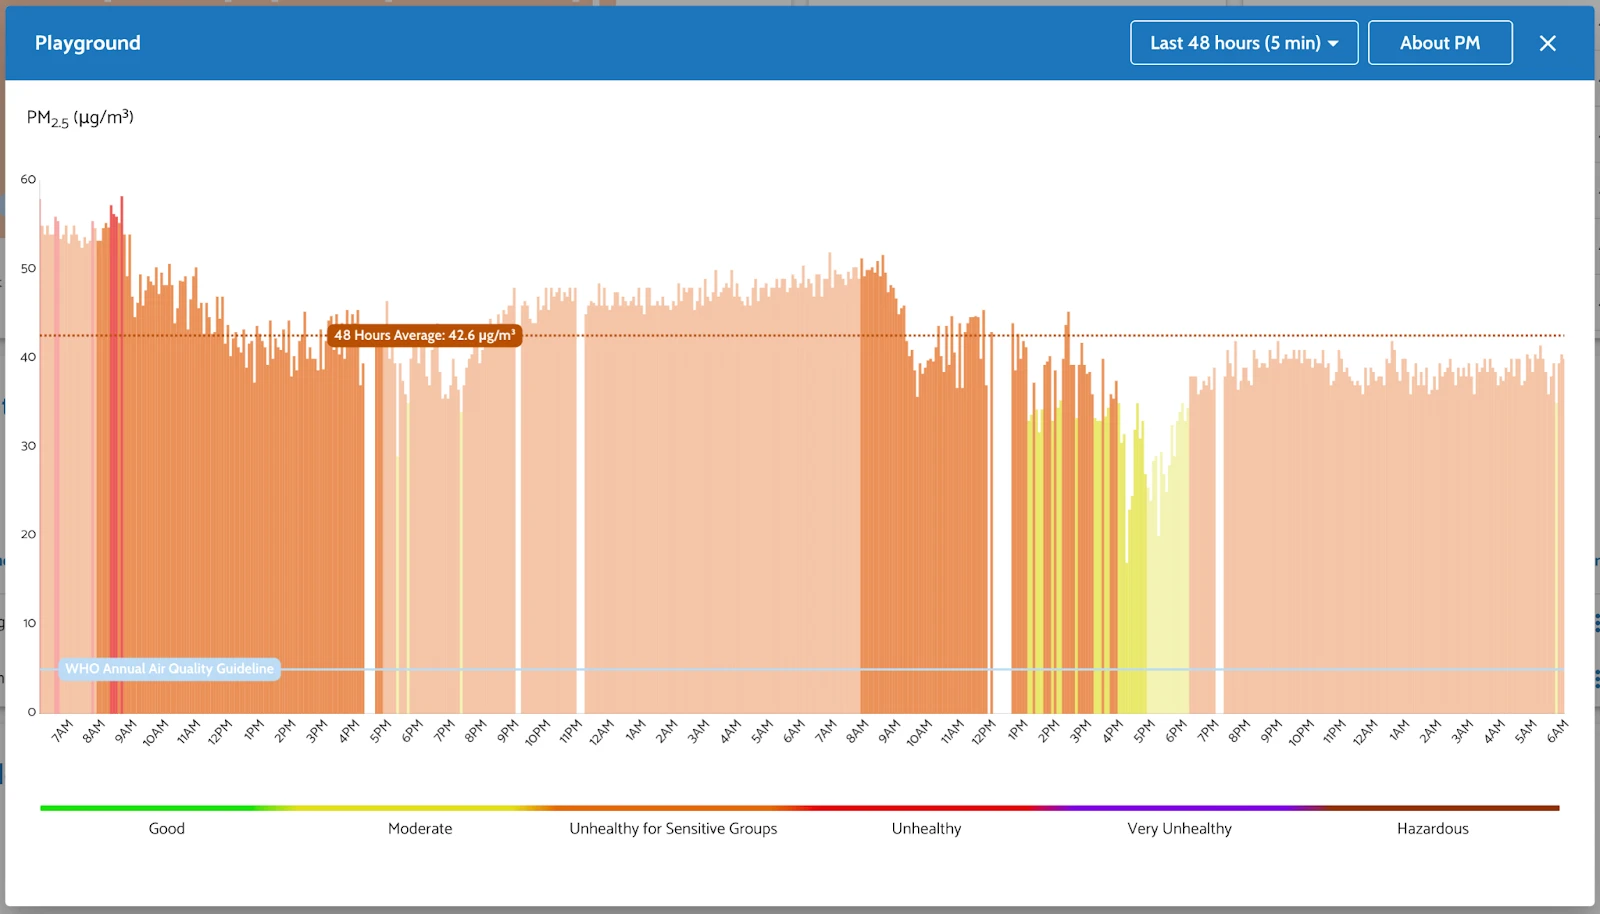
Outdoor PM2.5 (µg/m3) Graph
This section provides a detailed real-time graph of outdoor PM2.5 levels over time. It includes:
- A trendline showing the concentration of PM2.5.
- An average value for the selected time period.
- Temperature, humidity, and reduction percentage indicators to help assess air quality trends.
- A WHO guideline indicator for reference.
PM2.5 Rooms (µg/m3) Overview
This section displays the indoor PM2.5 levels, showing:
- A gauge with the current average PM2.5 value.
- A list of the top indoor locations with their respective PM2.5 measurements.
CO2 Rooms (ppm) Overview
This section provides a similar gauge but for CO2 levels indoors, showing:
- The current average CO2 concentration.
- A list of indoor locations with their CO2 readings.
Outdoor Locations Data Table
This section presents a table summarizing the air quality measurements from outdoor monitoring locations. It includes:
- PM2.5, CO2, temperature, humidity, heat index, TVOC and NO2 values.
- The last update timestamp.
- Admin options for further management.
Indoor Locations Data Table
Similar to the outdoor table, this section displays key air quality metrics for indoor locations, including:
- PM2.5 levels and reduction percentages.
- CO2 concentration, temperature, humidity, TVOC, and NO2 values.
- The last update time and admin options.
This dashboard provides a comprehensive overview of air quality, helping you to monitor and improve indoor and outdoor environments.
3.2 Custom Dashboard View
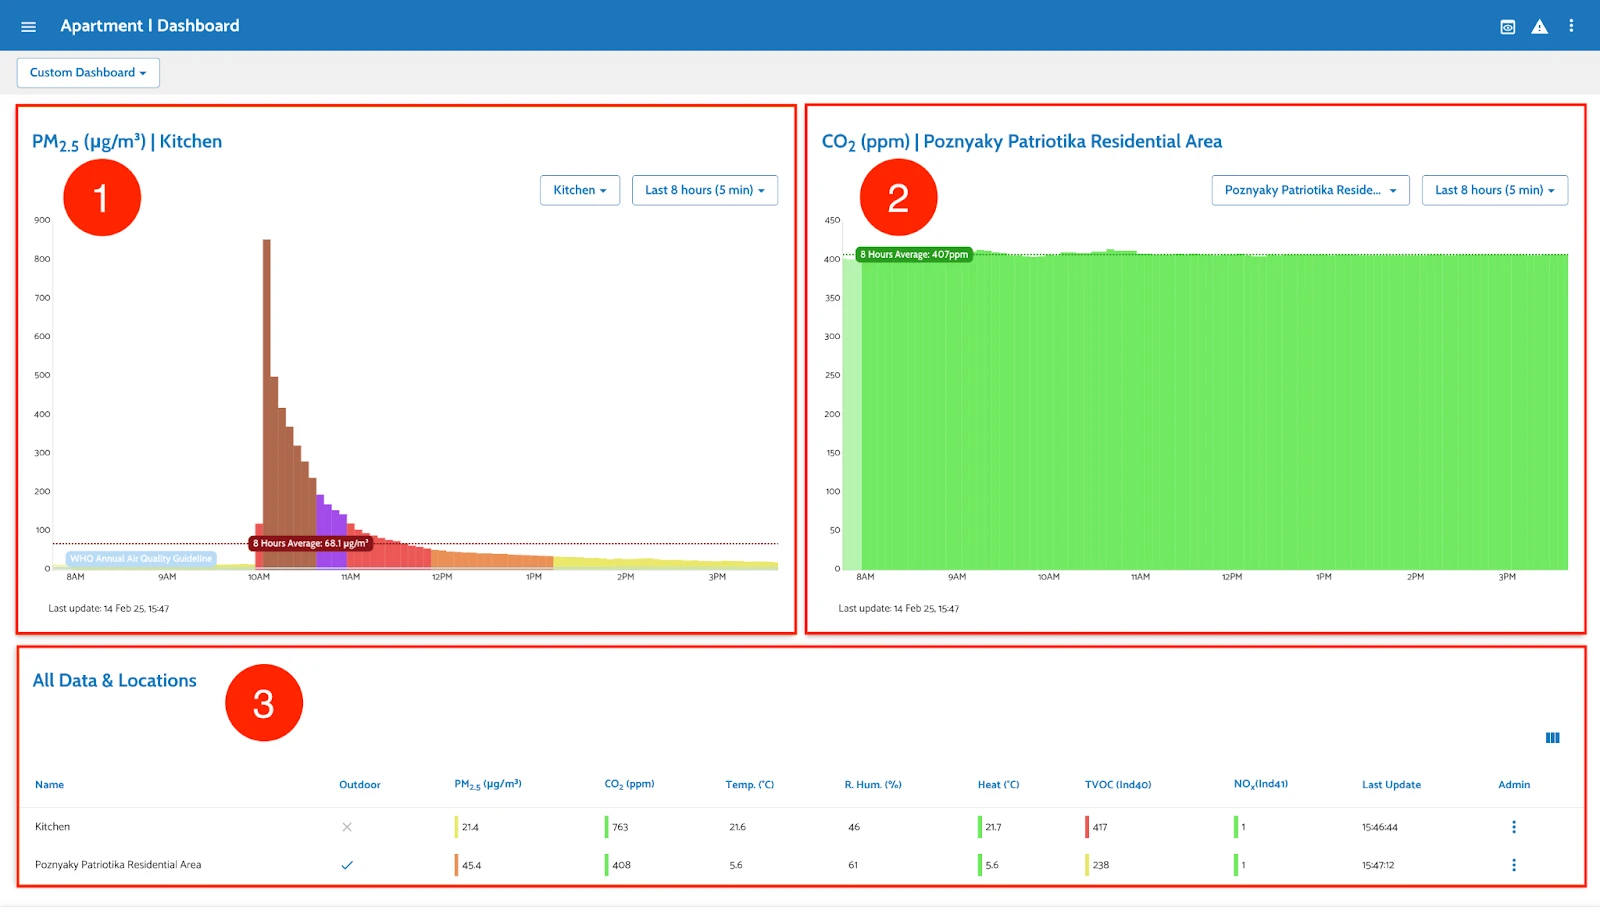
Here’s a quick overview of what we have on the Custom Dashboard based on the image and AirGradient's functionality:
PM2.5 (µg/m3) | Selected Location
- A detailed graph showing PM2.5 levels over time for the selected location.
- The user can choose a different location and select a date range to analyze air quality trends.
- The graph includes data for the chosen period of time and the WHO Air Quality Guideline for comparison.
CO2 (ppm) | Selected Location
- A real-time graph tracking CO2 levels for the selected location.
- Users can adjust the location and time range to analyze trends.
- The data for the chosen period of time is displayed to provide context for air quality assessment.
All Data & Locations Table
- A comprehensive table summarizing air quality metrics for all selected locations.
- Includes PM2.5, CO2, temperature, humidity, heat index, TVOC, and NO2 levels.
- Shows whether a location is outdoor or indoor.
- Displays the last update time and admin management options.
The Custom Dashboard allows users to customize their view by selecting specific locations and time periods, making it a flexible tool for analyzing air quality trends.
Additionally, you can configure most of the settings for your monitors. By clicking Edit Monitor under the actions of a specific location, you can:
- Adjust basic configuration settings (e.g., name, notes, etc.).
- Set brightness levels.
- Make your location public (if it's an outdoor location).
You can also view detailed charts for specific measures by clicking on them to see data for a selected period.
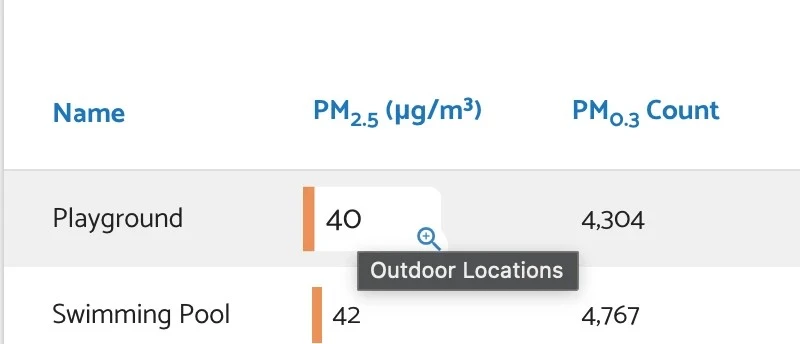
By pressing on the measurement value of your interest, you’ll be taken to the chart:
4. Help
On each page, tab or modal window you have a hand of help in case you want lo learn more \- help functionality \- that is a quick guide on what you see on the screen\!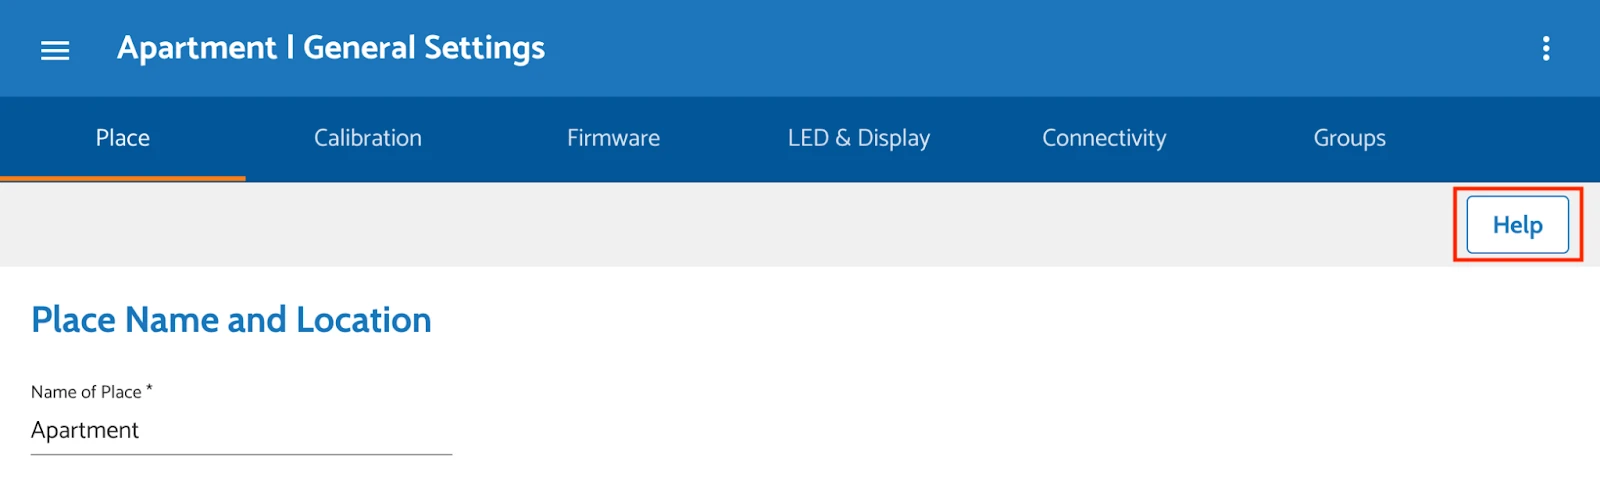
Or
5. Frequently Asked Questions (FAQs)
Here are the questions that may appear when you use the AirGradient Dashboard for the first time.Where can I find the Serial Number of my monitor?
First, you can find it on the packaging of your monitor. Don’t have quick access to the box? Don’t worry! The location of the serial number depends on the type of monitor you have, but it's still easy to find. For Open Air monitors, the serial number is engraved on the back. Also, when you connect it to Wi-Fi, you can see the serial number in the Wi-Fi settings of your smartphone or PC.
How can I add another monitor?
To do that, you can go to ‘Connect a Monitor’ in the side navigation menu:
Then press 'Next' and go through the onboarding process to add a new monitor to your dashboard!
What is a correction?
A correction is an adjustment applied to sensor readings to bring them closer to the true air quality values. We apply corrections to our sensor readings to improve accuracy. The reason for this is that raw sensor data is often affected by environmental factors, sensor drift, and inherent inaccuracies.
How can I add my friends to a place?
By going to ‘Users and Permissions’ and pressing the ‘Add New’ button, you will be prompted to enter your friend's email address and select the permissions to grant them.
What is firmware?
Firmware for AirGradient Monitors refers to the embedded software that controls how the monitor functions. It is essentially the operating system of the monitor, managing data collection, sensor readings, connectivity, and communication with the AirGradient platform. In simple words, firmware is a program that makes all the parts of your monitor work together as one system, like a team!
Developed by AirGradient in Collaboration with the UNDP Global Centre Singapore CC-BY-SA