Maintaining Data Quality and Accuracy
Reliable air quality data is essential for understanding pollution levels and maximizing the impact of your project. While AirGradient monitors are designed for accuracy and long-term reliability, sensor malfunctions, environmental factors, and calibration issues can still occur.
To help maintain data quality, the failure detection feature on the Dashboard automatically identifies certain sensor issues, as explained in this chapter. Additionally, by comparing readings across multiple monitors in a network, you can detect inconsistencies, identify subtle sensor faults, and continuously calibrate your sensors to improve overall accuracy. These network-based features are also integrated into the Dashboard, making it easier to ensure reliable measurements.
Key Highlight
This chapter explains how to identify faulty sensors and continuously calibrate monitors to ensure accurate and trustworthy data over long periods of time.
1. Automatic identification of faulty sensors
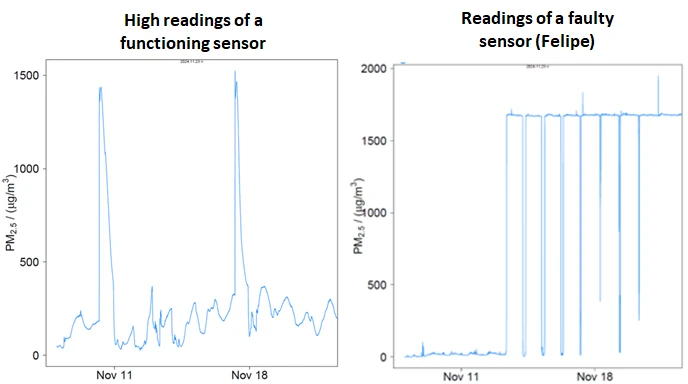
One of the most well-known anomalies affecting Plantower PM2.5 sensors is called the “Felipe”1 Anomaly.
A “Felipe” occurs when a PM2.5 sensor suddenly reports an extremely high value, typically above 1000 μg/m3, and remains stuck at that level for an extended period — ranging from several hours to even months. These readings are physically unrealistic and are therefore classified as faulty. This issue is rare, affecting roughly 1 in 1000 monitors. It has also been observed in devices from other manufacturers that use the same Plantower sensor module.
Note that high reading alone does not necessarily mean your sensor is faulty. Short-term spikes above 1000 μg/m3 can happen in severely polluted environments. Below is a comparison showing a Felipe anomaly (right) alongside a healthy sensor operating in a very polluted environment (left).
To address the Felipe anomaly, the Dashboard includes an automatic detection tool that flags sensors exhibiting this behavior. Affected monitors are marked with an exclamation mark in the sensor overview and highlighted in red. Additionally, users can set up email alerts to be notified in case of a suspected sensor failure.
This feature is currently being implemented.
What to Do if You Spot a Faulty Sensor?
- Inspect for Damage – Check for visible issues such as physical damage, dirt buildup, or obstructions (e.g., dust or insects) that might interfere with sensor readings. If you find a possible cause, remove it and observe whether the sensor returns to normal operation. Chapter 4 provides detailed instructions on how to check your monitor for faults and clean it.
- Replace if Necessary – If no clear cause is found, replace the sensor module within the affected monitor. For assistance, submit a support ticket via the AirGradient website: AirGradient Support.
2. Using your monitor network to increase accuracy
As discussed in Chapter P2 - Defining Your Air Quality Project, air pollution is composed of two main elements: regional background pollution, which remains relatively uniform across large areas, and local emissions from sources like vehicles, industrial facilities, or residential heating.
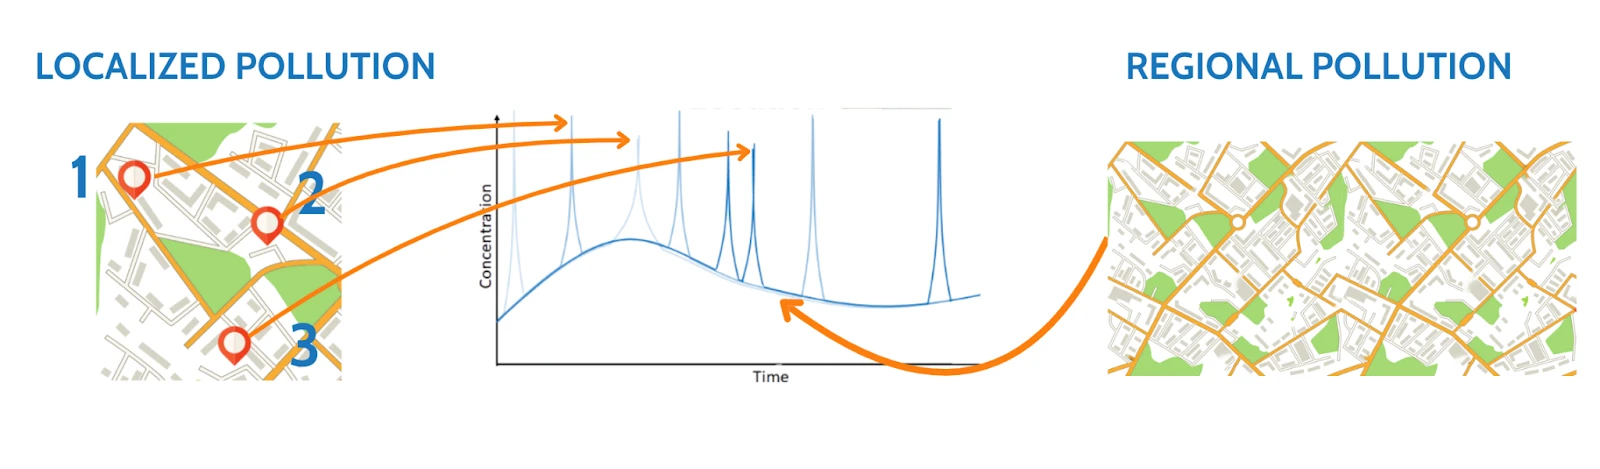
A well-distributed network of AQ monitors provides a big advantage: since all monitors in the area are subject to the same background pollution levels, their readings can be compared and cross-validated. This network effect can be used to detect anomalies and calibrate sensors, leading to a better measurement accuracy.
2.1 Identifying Faulty Sensors in a Monitor Network
In a properly functioning network, sensor readings should follow a consistent pattern. This consistency allows us to
spot any unusual readings that could indicate a problem.
For example, an analysis of PM2.5 readings from 16 AirGradient monitors in Pai, Thailand, showed that 15 sensors
followed the same baseline (i.e. the regional air pollution levels), while one sensor (green line) consistently reported
significantly lower values despite being in the same network. This discrepancy suggests a potential fault that requires
investigation.
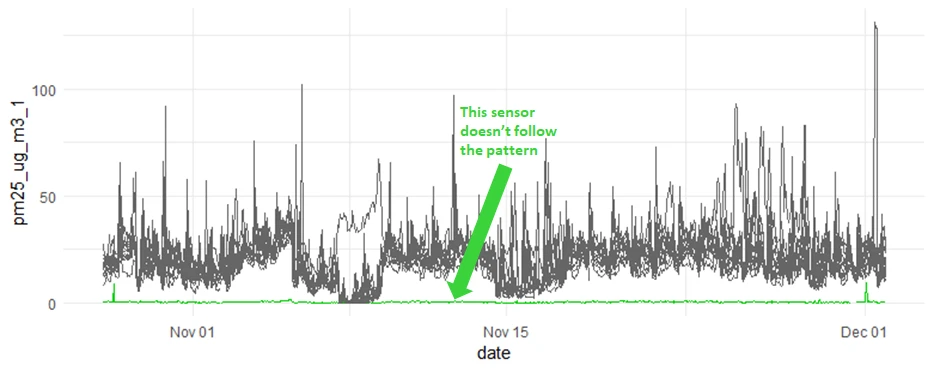
By regularly comparing readings across the network, faulty sensors can be quickly detected and addressed, ensuring accurate and reliable air quality data.
When Should I Be Worried?
Not every divergence in readings means a sensor is faulty. Short-term variations can often be explained by local emission events—such as nearby traffic, cooking, or open burning—that affect only one monitor’s immediate surroundings. However, if a sensor consistently reports values that are significantly higher or lower than neighboring monitors over an extended period (e.g. several days or weeks), this may indicate a calibration issue or sensor failure.
Other signs of concern include:
- Flatlined data (no variation over time)
- Sudden step changes without a clear environmental cause
- Frequent dropouts or erratic spikes not mirrored by other monitors
AirGradient is currently developing a feature that will automatically perform these regular checks and alert you when a sensor shows unusual behavior.
What to do if you spot a potentially faulty sensor?
If you identify a sensor that is not following the expected pattern, follow these steps to confirm and resolve the issue:
- Check Placement – Ensure the sensor is properly positioned, exposed to outdoor air, and has free airflow. Avoid placing it too close to walls, under roofs, or near obstructions that could affect air circulation.
- Check for Changes in the Surroundings – Investigate whether anything in the local environment has changed recently, such as the opening of a nearby BBQ restaurant, construction site, or other new sources of emissions that could influence readings.
- Inspect for Damage – Look for any visible damage, dirt buildup, or obstructions like dust or insects that might interfere with the sensor’s readings.
- Swap or Relocate the Sensor – If possible, move the sensor to a different location and see if the readings align better with the rest of the network. This helps rule out environmental factors affecting its performance.
- Replace if Necessary - If no clear cause is found, replace the sensor module within the affected monitor. Send a support ticket through the AirGradient website for assistance: https://www.airgradient.com/support/
2.2 Ongoing network calibration
If a reference instrument is available within or near your sensor network and measures the same regional background pollution—which most reference instruments do—you can use its data for continuous calibration of your network.
The background extraction function on the Dashboard allows you to isolate regional pollution levels from your network’s data. This process is explained in more detail in Chapter S8 (Monitor Calibration, Section 5.2: Network Extraction). Once extracted, the background data can be compared with the readings from the reference instrument to ensure alignment. The tool then automatically calculates calibration parameters and applies them across the entire sensor network, improving measurement accuracy.
The network calibration tool follows a very similar approach to the Calibration with a Local Reference Instrument, as described in Chapter S8 (Section 4).
3. Frequently Asked Questions (FAQs)
How can I tell if one of my monitors is faulty?
Look for signs such as unusually flat data, sudden unexplained spikes, or readings that are abnormally high or low. You can also use the network extraction feature to identify sensors showing unusual behavior. Additionally, the Dashboard’s automatic detection tools can flag major anomalies, such as the “Felipe” event.
What is the cause of the ‘Felipe’ anomaly?
We do not know, but we know it is related to the PM sensor from Plantower. We use that sensor in our monitors. Other companies that use the same PM sensor have reported the same anomaly too. We are working on understanding the reasons behind this anomaly.
What should I do if I suspect a sensor is faulty?
First, check the monitor’s placement and surroundings for anything that might be affecting airflow or introducing local emissions (e.g., a nearby restaurant or construction). Inspect the unit for damage or blockages, and try relocating the sensor. If the issue persists, the sensor may need to be replaced.
How can using multiple monitors help improve data accuracy?
A network of monitors lets you cross-check readings. Since regional background pollution tends to be similar across locations, large or long-term differences between monitors can help identify faulty sensors or areas needing recalibration.
When is a reading difference just local variation, not a fault?
If a sensor briefly shows different values than others, it could be due to local events like a passing car, outdoor cooking, or wind patterns. Persistent differences over days or weeks, however, are more likely to indicate a problem with the sensor or its environment.
Can I calibrate my network automatically?
Yes. If you have access to a nearby reference-grade instrument, the Dashboard’s background extraction and calibration tools can be used to align your sensor network.
Support Section
| support@airgradient.com | ||
| Website | www.airgradient.com/support | |
| Discussion Forum | www.forum.airgradient.com |
Why the name Felipe?
This anomaly was first reported by Felipe, a concerned member of the AirGradient community who noticed alarmingly high air pollution levels on his monitor. After investigation, it became clear that the readings were faulty, as such values were not physically possible. Since then, this type of error has been called a " Felipe", with Felipe’s kind permission. ↩︎
Developed by AirGradient in Collaboration with the UNDP Global Centre Singapore CC-BY-SA