Configuring Your Dashboard
Now that you’ve successfully connected your monitors, they should be sending data to the Dashboard. It’s time to personalize your Dashboard experience.
The AirGradient Dashboard application is designed to give you easy access to your monitor data, enabling you to explore, analyze, and share information. You can configure your monitors or view data from all your monitors in charts and various data tables.
While the dashboard has many features and capabilities - ranging from basic to advanced - we will cover those in a later manual. For now, we want to outline the first steps you should take after creating a dashboard account.
Key Highlight
The AirGradient dashboard allows you to configure and customise your monitors as needed. It also allows for many advanced features, such as the setting of alarm notifications, creation of display widgets, and much more.
1. Add Additional Monitors
If you are setting up multiple monitors, you will need to add them to the dashboard to aggregate data in one place. You can either follow the onboarding wizard guide or add additional monitors in the steps described below.
Link to the page for adding additional monitors.
1.1. Access Hardware Administration
- Open the AirGradient Dashboard and click on the three-line menu icon in the top left corner to access the navigation panel.
- From the navigation menu, select “Hardware.”
1.2. Add New Monitor
- On the Hardware Administration page, click the “Add New” button located in the top right corner. This will initiate the onboarding process for your new monitor. If you can not see this button, you may need to contact the dashboard administrator for permissions.
1.3. Follow Onboarding Wizard
- You will be prompted to enter the new monitor’s serial number, manufacturer (AirGradient), monitor type and a note. This note can be used to help sort and organise the monitor (which we discuss in the next section of this document).
1.4. Name and Assign Location
- Once the monitor is connected, you’ll be asked to give it a descriptive name and assign it to a specific location.
- Choose a name that clearly identifies the monitor’s placement, such as “District 3 - School A” or “Central Park - Playground.”
1.5. Confirm and Save
- Review the monitor details and location assignment, then click the “Save” button to add the new monitor to your dashboard.
2. Name and Organize Locations
Clear and organized location names are essential for effectively managing your network of outdoor air quality monitors, especially within a city environment with a dense network. This allows you to quickly identify and analyze data from specific monitoring sites, facilitating better air quality management and decision-making.
If you already named your monitors when setting them up, you can skip this section. However, we recommend reviewing the monitor names and organization to ensure they are easy to understand for all users.
Link to the page for naming and organizing locations.
To name and organize your monitor locations, follow these steps:
2.1. Access Locations Administration
- Open the AirGradient Dashboard and click on the three-line menu icon in the top left corner to access the navigation panel.
- From the navigation menu, select “Locations.”
2.2. View Existing Locations
- The Locations Administration page displays a list of all your monitoring locations. Each location is associated with a specific monitor.
2.3. Name or Rename Locations
- When you first set up your monitors, they might have default names or be identified by their serial numbers. To make them more informative, click on a location to edit its details.
- Assign a clear and descriptive name that accurately reflects the location of the monitor. For instance, instead of " Monitor 1," use a name like “District 1 - Park A” or “City Hall - Main Entrance.”
- Consider using a consistent naming convention, such as “[District] - [Landmark/Area],” to ensure uniformity and easy identification.
- You may also want to include the monitor model in the location name. For example “District 1 - City Hall, Open Air Max’.
2.4. Organize Locations (Optional)
- For larger organizations with numerous monitors across the city, you might consider grouping locations based on districts, zones, or areas of interest. This can be done using the “Groups” feature in the General Settings.
- Grouping locations allows you to filter and analyze data more efficiently, focusing on specific areas of the city as needed.
By following these steps, you can establish a well-organized and easily navigable system for managing your outdoor air quality monitoring network. This will improve data analysis, reporting, and overall air quality management within your city.
3. Add Other Users to the Dashboard
Collaboration is key to effective air quality management. The AirGradient Dashboard allows you to add other users to your account, enabling colleagues, stakeholders, or other authorized personnel to access and interact with your air quality data. Please note that, depending on the permissions given to the users, they have full control of the dashboard. Only allow trusted users to have admin permissions on the dashboard.
Link to the page for adding other users to the dashboard.
To add users to your dashboard, follow these steps:
3.1. Access Users & Permissions
- Open the AirGradient Dashboard and click on the three-line menu icon in the top left corner to access the navigation panel.
- From the navigation menu, select “Users & Permissions.”
3.2. Add New User
- On the Users & Permissions page, click the “Add New” button to initiate the user addition process.
3.3. Enter User Details
- A pop-up window will appear, prompting you to enter the email address of the user you want to add.
- If you would like them to receive an email notifying them about the dashboard access, please tick the ‘Send Invitation Email’ box.
3.4. Define Permissions
- Choose the appropriate permission level for the user. You can grant them “Viewer” access, allowing them to only view data, or “Admin” access, which grants them full control over the dashboard settings and configurations. There are also different admin levels, which allow administrative control of different aspects of the dashboard.
3.5. Save User
- Once you’ve entered the user details and selected the desired permissions, click the “Save” button to add the user to your dashboard.
Important Considerations
- User Roles: Carefully consider the roles and responsibilities of each user before assigning permissions. Granting “Admin” access should be reserved for trusted individuals who require full control over the dashboard.
- Data Security: Be mindful of data sensitivity and privacy when adding users. Ensure that only authorized personnel have access to your air quality data.
- Communication: Clearly communicate with new users about their roles, permissions, and how to use the dashboard effectively.
By adding users and assigning appropriate permissions, you can foster collaboration, improve data accessibility, and enhance your organization’s air quality management strategies. This also allows stakeholders to view progress and changes in air quality.
4. Set Up Alarms & Notifications
Alarms & Notifications are crucial for staying informed about changes in your air quality. They provide timely alerts when specific air quality measurements exceed predefined thresholds or meet certain conditions. This allows you to take immediate action to improve your indoor environment and protect your health.
Link to the page for setting up alarms and notifications.
To set up Alarms & Notifications, follow these steps:
4.1. Navigate to Alarms & Notifications
- Open the AirGradient Dashboard and click on the three-line menu icon in the top left corner to access the navigation panel.
- From the navigation menu, select “Alarms & Notifications.”
- On the ‘Alarms & Notifications’ screen, press “Add New” in the top-right corner.
4.2. Choose Your Monitor and Measurement
- In the new alarm section, you’ll see a list of your connected monitors.
- Select the monitor for which you want to configure alarms. You can also set alarms based on averages across all monitors.
- Then, choose the specific air quality measurement (e.g., PM2.5, CO2, temperature, humidity) that you want to monitor.
4.3. Set Thresholds and Conditions
- Define the thresholds or conditions that will trigger an alarm. For example, you might set an alarm for when PM2.5 levels exceed 35 µg/m3.
- You can also configure the duration for which the condition must be met before an alarm is triggered. This helps prevent false alarms due to temporary fluctuations.
4.4. Configure Notification Preferences
- Choose how you want to be notified when an alarm is triggered. You can opt for email notifications, on-screen alerts within the dashboard, or both.
- If you select email notifications, make sure your email address is correctly configured in your user profile.
4.5. Save Your Settings
- Once you’ve configured the alarm settings to your preferences, click the “Save” button to activate the alarm.
Example Alarm Configuration
Let’s say you want to be alerted when PM2.5 levels exceed a 35 µg/m3 average across all outdoor monitors for more than 15 minutes. You would:
- Select your “All Outside Monitors” from the list.
- Choose “PM2.5” as the measurement.
- Set the threshold to “35 µg/m3”
- Set the duration to “15 minutes.”
- Enable email notifications.
By following these steps, you can effectively utilize the Alarms & Notifications feature to proactively respond to air quality changes. Remember to periodically review and adjust your alarm settings as needed to ensure they align with your current preferences and air quality goals.
5. Set Up a Public Widget/Display
Sharing your air quality data with the public can promote transparency and raise awareness about environmental conditions. The AirGradient Dashboard allows you to create custom displays and widgets that can be embedded on websites or displayed on public screens, making your air quality information accessible to a wider audience.
Link to the page for setting up public widgets and displays
To create a public display or website widget, follow these steps:
5.1. Access Hardware Administration
- Open the AirGradient Dashboard and click on the three-line menu icon in the top left corner to access the navigation panel.
- From the navigation menu, select “Hardware.”
5.2. Navigate to Public Displays/Website Widget
- On the Hardware Administration page, click on the “Public Displays/Website Widget” tab at the top of the screen.
- If you don’t see this option, you may need to contact your dashboard administrator or AirGradient support to enable it.
5.3. Add New Display
- Click the orange “Add New” button in the top right corner of the Public Displays/Website Widgets tab.
5.4. Name and Configure Display
- Enter a name for your display. This name is for internal use and won’t be visible on the public display.
- Select the locations and air quality parameters (e.g., PM2.5, CO2, temperature) that you want to include in the display. You can also choose to display outdoor and indoor averages.
5.5. Customize Styling
- After clicking “Create,” you’ll be directed to the styling tab.
- Choose between light and dark themes or select “custom” for more advanced styling options.
5.6. Generate and Share Link
- Click “Next” to generate a public link for your display.
- This link can be shared with anyone, allowing them to view the display in their web browser.
- You can also embed this link on your website to integrate the display seamlessly.
By creating public displays and website widgets, you can effectively communicate your air quality data to a broader audience, fostering transparency and promoting community awareness about environmental health.
Display Ideas
Since these displays and widgets can be very easily shared and used to promote air quality awareness, here are a few suggested implementations:
- Display data on a local website. Since the link can be embedded on any website, you can easily display the local air quality information on websites. This can work very well to promote awareness on local news, government, and weather websites.
- Display data on a public screen. Data can also be easily displayed through a web browser, making it easy to display on a screen in a public area. Schools, town halls, and even apartment buildings are great places to display this data.
- Share the link. Since every display has a unique link, you can share it with anyone for quick access to local air quality conditions. If you have local community groups on social media or messaging platforms, the link can be shared there.
Support Section
Still have any questions?
If you would like some help or just want to learn more, you can do so anytime by going to the Support page through
sidenav menu:
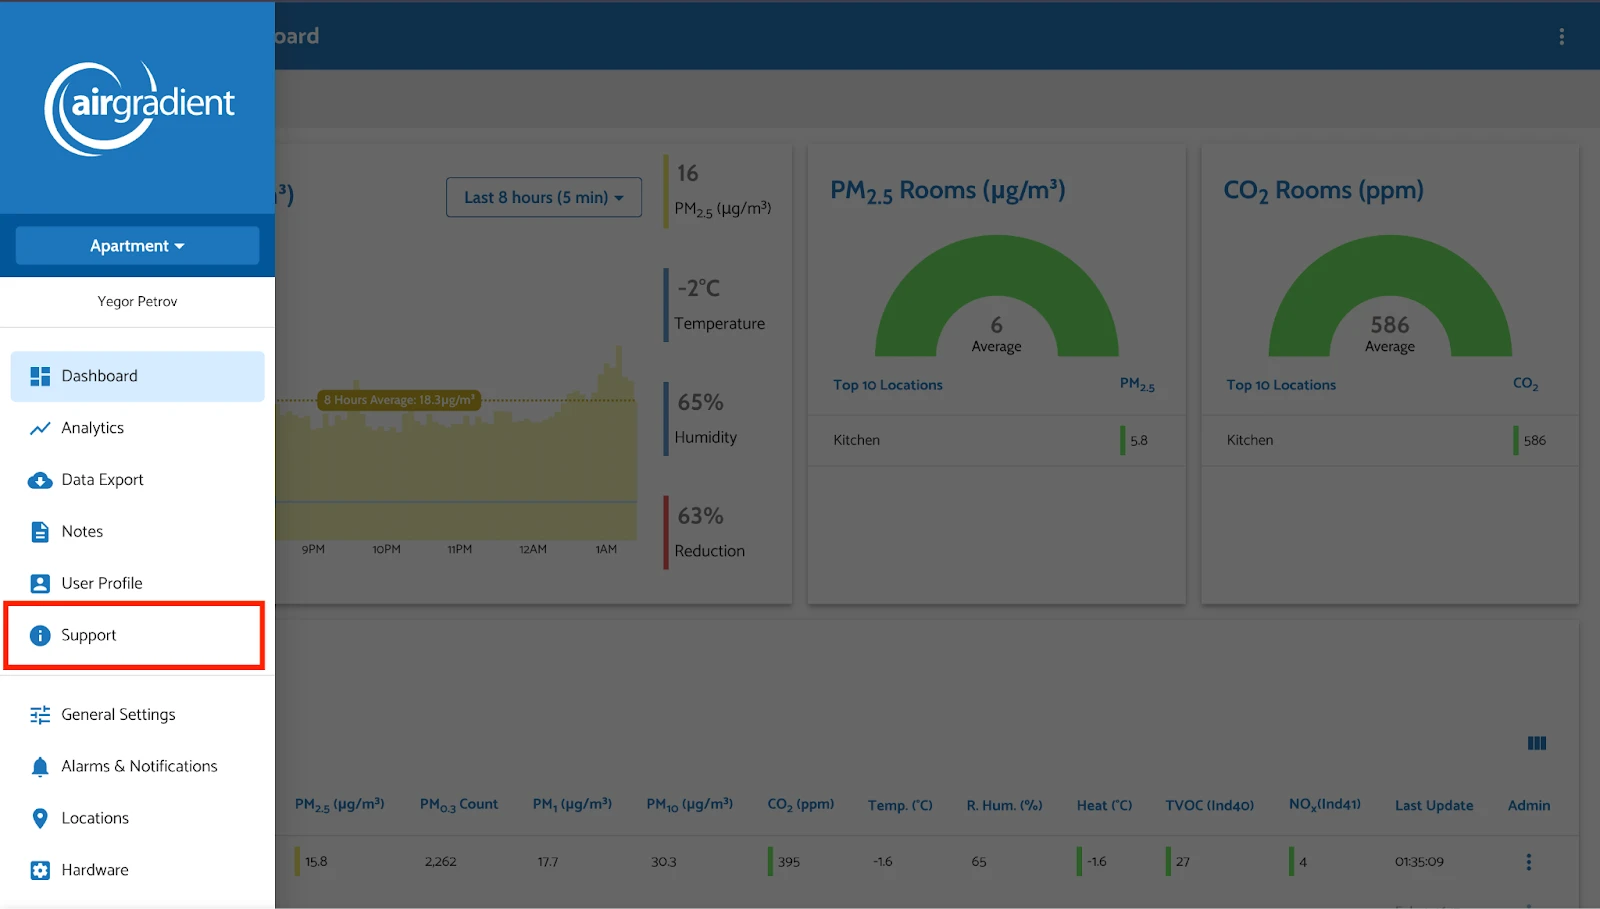
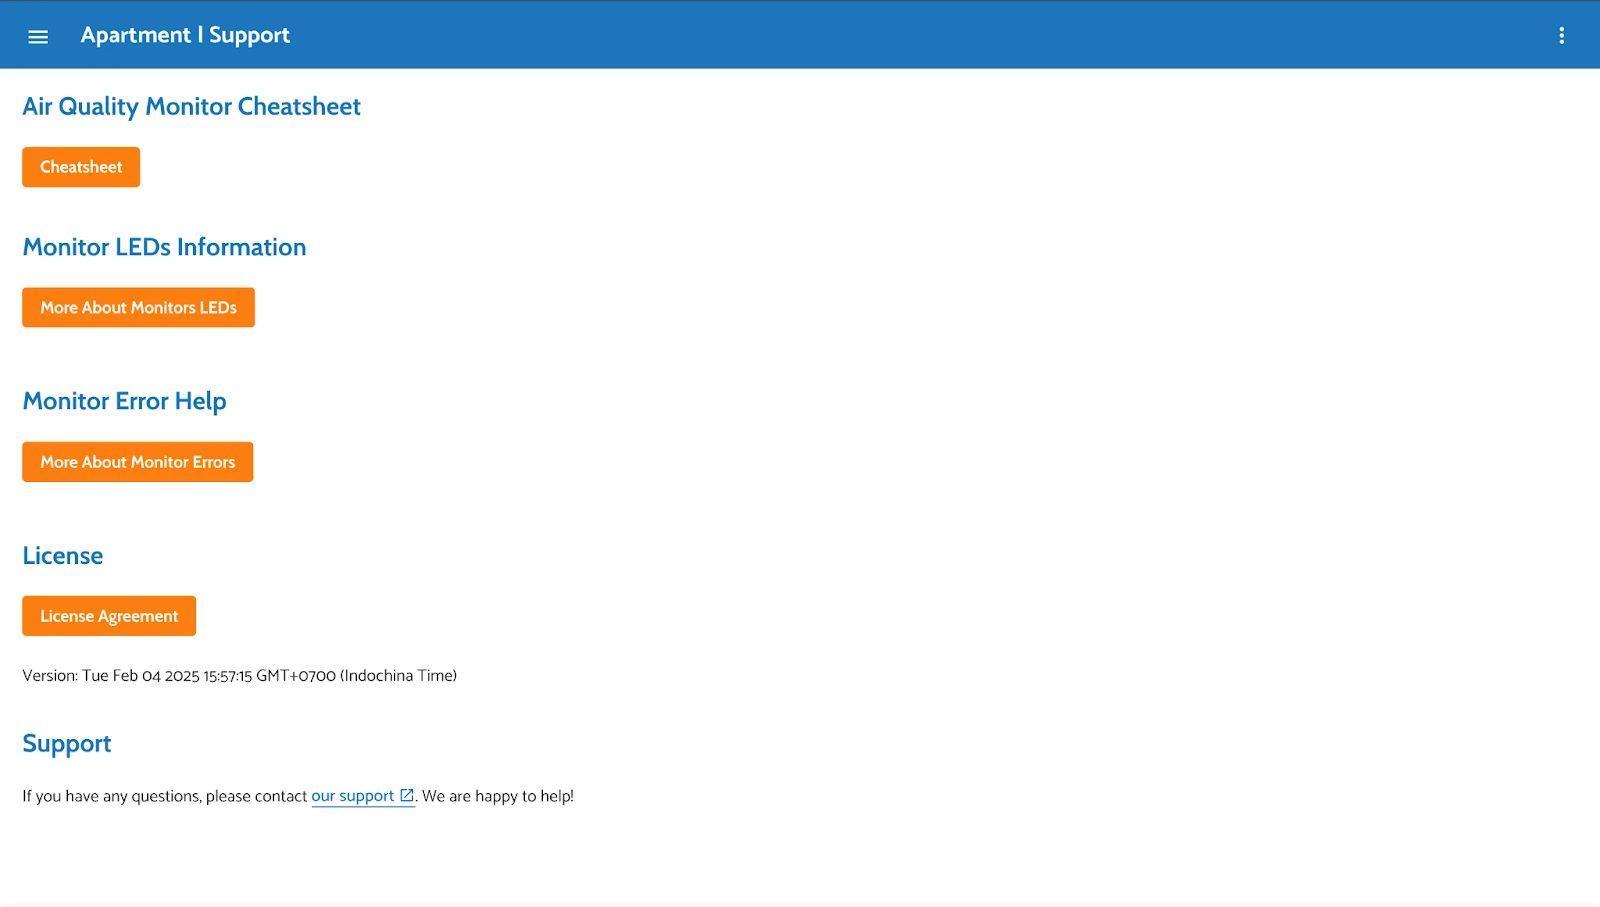
After pressing you appear on our support page:
Or, if you have a topic to discuss with others, you can go to our forum and start a discussion on our forum.
| support@airgradient.com | ||
| Website | www.airgradient.com/support | |
| Discussion Forum | www.forum.airgradient.com |
Developed by AirGradient in Collaboration with the UNDP Global Centre Singapore CC-BY-SA