Over the past few months, I’ve noticed the same air-quality myths coming up again and again, whether on Reddit, in emails, in support requests, and most recently in a YouTube review of our own devices. The review wasn’t malicious. In fact, it was quite the opposite, as the creator was trying to understand what the numbers meant. But several of the criticisms stemmed from misunderstandings that have become surprisingly common in the air-quality community. It’s become increasingly clear that these myths are everywhere.
Honestly, I can even understand the confusion. I've reached out to some air-quality brands in the past with what I thought were simple technical questions, only to realise that some of the companies themselves often didn’t fully understand the behaviour of the sensors inside their own products. This isn’t true for everyone - some manufacturers have an exceptional grasp of the science and technology - but there are also many who simply assemble a device, assume the sensor vendor has “taken care of the hard parts,” and ship it. If the people building the monitors don’t always understand how they work, how can the average user be expected to?
That’s why I wanted to write this article. These myths directly impact whether you should trust your monitor, and, in some cases, they even compound. I’ll break down some of the most common misunderstandings I see and explain why they matter. My aim isn’t to scare anyone away from air-quality monitoring (it's quite the opposite!), but when you understand what your device can and can’t tell you, it becomes a far more powerful tool.
With that said, let’s jump into the first myth.
Myth: If a Monitor Shows a Number, You Can Assume It’s Accurate
For most people (especially if they’re new to air quality monitors), the moment a device displays a number like “17 µg/m³,” “842 ppm,” or “134 ppb”, it instantly feels authoritative. Numbers imply precision. They feel objective. But with air quality monitoring, a number is only as trustworthy as the sensors, algorithms, assumptions, and testing behind it. A simple readout on a screen doesn’t guarantee that what you’re seeing reflects reality. It simply means the device was able to generate a number.
In many cases, that number is shaped by a lot of hidden processing. Most manufacturers don’t share how their sensors were calibrated, which correction curves they applied, how much smoothing they use, or the averaging behaviour in use. Some devices rely entirely on the sensor module’s built-in, undisclosed “factory calibration.” Others apply their own firmware-based adjustments but never document what they changed or why. A few even hide the identity of the sensor module entirely, making it impossible to evaluate what the reading is based on.
VOC sensors are the best example of when you shouldn’t trust the number. When a monitor shows something like “134 ppb” of tVOCs that number is almost never an actual ppb measurement. It’s usually derived from an index on a relative scale produced by a metal-oxide sensor responding to broad chemical reactivity, not specific molecules. The device simply converts that index into a fake “ppb” number because it looks scientific. We’ll dig deeper into why VOC sensors are such a challenge later in the article, but the takeaway here is simple: a “VOC ppb” value on a typical low-cost monitor may have no relationship to the real concentration at all.
None of this means air quality monitors are useless. Quite the opposite! It just means their numbers shouldn’t be treated as unquestionable truth. Reliable measurements come from validated hardware, transparent calibrations, and clear documentation, not opaque firmware pipelines or misleading units. When you understand how your device generates its numbers, you’re far better equipped to interpret them and less likely to be misled when something looks unexpectedly high or suspiciously clean.
This leads directly into the next myth, one that surprises many people.
Myth: Most Air Quality Monitor Manufacturers Thoroughly Test Their Sensors
The unfortunate truth is that many (I might even go so far as to say ‘most’) low-cost air quality monitors are barely tested at all. Many brands imply (or outright claim) that every device is calibrated, validated, or “lab tested” before shipping. In reality, the vast majority of consumer-grade monitors are assembled, powered on long enough to confirm that the screen lights up, and then packaged. There is rarely any meaningful sensor verification or other more advanced testing.
Part of the issue is structural, as most manufacturers rely on fully pre-calibrated modules from companies like Plantower, Cubic, or Sensirion and assume the sensor manufacturer’s internal calibration is “good enough.” The problem is that these modules are essentially black boxes - their calibration methods, reference instruments, correction curves, and environmental assumptions are almost never disclosed. We don’t know what aerosol they were calibrated with, how the particle size distribution was chosen, how humidity was handled, or what smoothing or filtering sits inside their firmware. Without that transparency, it’s impossible to know how well the “factory calibration” will hold up outside the controlled conditions it was tested in.
An even bigger issue is how many devices are subcontracted. A large portion of consumer air quality monitors aren’t built (or even assembled) by the companies selling them. Instead, they’re produced by OEM factories that offer a “ready-made” design, meaning the brand themselves often have little involvement in how the device actually works. In these cases, the company selling the monitor never touches calibration equipment, never performs validation, and may not even know the details of the algorithms inside the firmware.
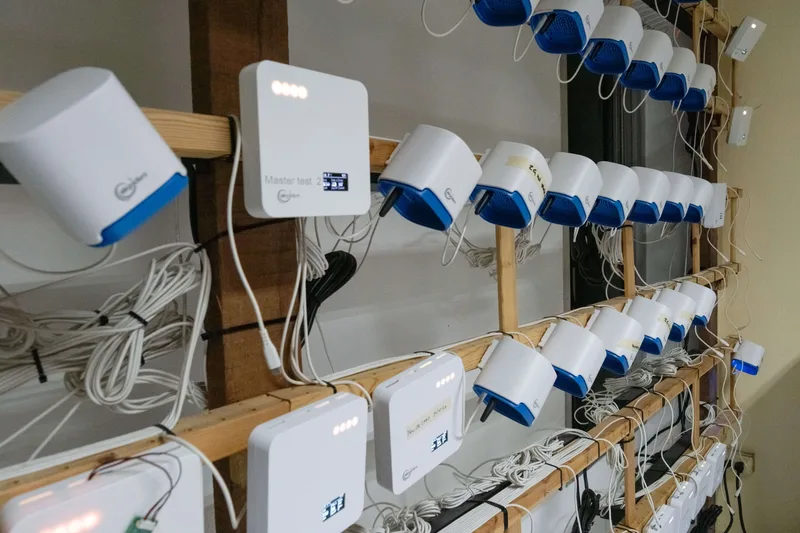
This is why companies that take a more rigorous approach to both transparency and accuracy tend to stand out. In our own work, we’ve seen how essential it is to actually validate sensors ourselves, by comparing particle concentrations against a reference instrument, and individually calibrating each sensor. It’s a very different mindset from the common “assemble and ship” approach, and it gives us a fundamental understanding of exactly how the sensors we use work.
Myth: PM₂.₅ Numbers Are Directly Comparable
“Factory calibrated,” “lab calibrated,” “pre-calibrated” are terms that all give the impression that if your device shows “20 µg/m³,” that number must be both accurate and meaningful. But even when a PM sensor is calibrated properly and the number is technically correct, it can still represent completely different health risks depending on what the particles actually are.
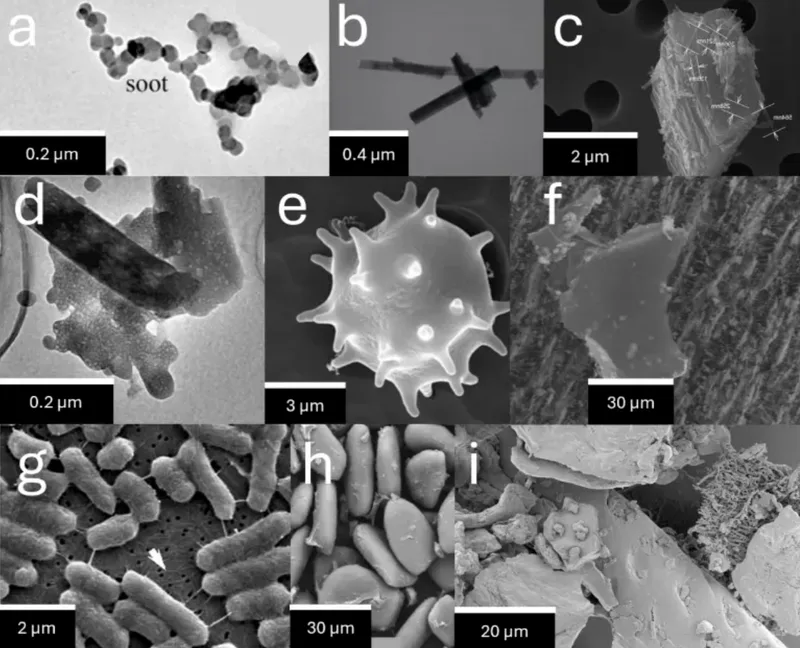
The core issue is that PM₂.₅ isn’t a single pollutant. It’s a category that includes a huge range of particle types: soot, wildfire smoke, sea salt, fungal spores, brake dust, tyre wear, cooking aerosols, mineral dust, and more. These particles differ not only in how they scatter light but also in toxicity, solubility, biological impact, and how deep into the lungs they can penetrate. Under an electron microscope, many PM₂.₅ particles don’t even remotely resemble each other.
This diversity has two major consequences:
- Sensors interpret different particles very differently.
Because low-cost PM sensors infer mass from light scattering, their calibration can only ever be optimised for one particle type at a time. A calibration built on incense smoke behaves well for incense, but not necessarily for dust, wildfire smoke, plastic-fire smoke, or sea salt. This is an unavoidable limitation of optical PM measurement. - The same mass concentration can have very different health implications.
A sensor might tell you that the air contains “20 µg/m³,” but that single number hides wildly different risk profiles. Sea salt particles may dissolve in the lungs and clear relatively easily, while wildfire smoke carries reactive organic compounds and ultrafines that drive inflammation. Plastic-burning smoke can be even more hazardous due to toxic compounds that adhere to soot surfaces. Even cooking aerosols behave differently depending on the type of oil, the temperature, and whether the particles are solid, liquid, or a mix of both. A sensor sees all of these as the same “20 µg/m³”, but your body certainly does not.
This complexity is also why specialised correction algorithms exist. The U.S. EPA’s correction for Plantower sensors, for example, significantly improves accuracy during wildfire smoke events (its intended purpose) but performs poorly during dust events. The algorithm isn’t flawed, but is rather only tailored to one particle type and not another.
The key takeaway is that a PM₂.₅ number is only part of the story. To interpret it meaningfully - especially from a health perspective - you need context. What kind of particles are present? Is the sensor’s calibration appropriate for this environment? Because every calibration is tied to a specific aerosol under specific conditions, the process should be clearly documented so users know what assumptions were made.
Myth: Sensors Only React to Their Target Pollutant
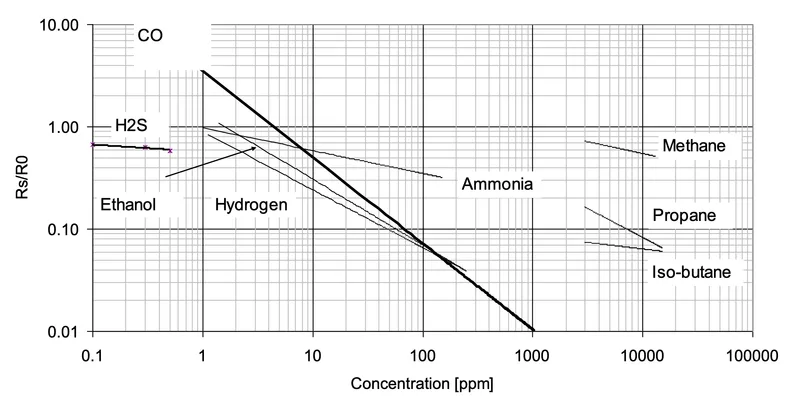
Now that we’ve covered how calibration depends heavily on particle type (and how PM₂.₅ itself is a wildly diverse category) it’s worth looking at another assumption that causes a lot of confusion: the idea that sensors measure only the pollutant written on the label. It would make perfect sense for a CO₂ sensor to measure CO₂ and for a VOC sensor to measure VOCs accurately and consistently. But in reality, many low-cost sensors respond to far more than their intended target pollutant. This behaviour is known as cross-sensitivity, and it’s far more common than most people realise.
Metal–oxide sensors (MOS) are the most notorious example. These are the little “VOC” sensors found in most affordable indoor monitors, and while they’re often marketed as detecting “chemicals,” “formaldehyde,” or just general “air quality,” what they actually measure is broad chemical reactivity. Ethanol from hand sanitiser, perfume, lotion, cooking fumes, sweat, cleaning sprays, air fresheners, even humidity fluctuations - all of these can trigger a spike. Even a ripe banana can set off a “poor air quality” warning on many inexpensive VOC monitors just as easily as a solvent.
The same issue appears, sometimes even more dramatically, in cheap “CO₂” monitors that don’t measure CO₂ at all. Instead, they report eCO₂ (equivalent CO₂), inferring levels from VOC reactivity. Walk into a room wearing perfume or spray an air freshener, and the “CO₂” reading can jump by hundreds or even thousands of ppm. These monitors aren’t malfunctioning, but rather, they’re doing exactly what their underlying sensor is designed to do. The problem is that many consumers don’t know the difference between true NDIR CO₂ sensors and eCO₂ algorithms, and manufacturers rarely make this distinction clear (especially if they're selling a device with an eCO₂ output) .
Even the other sensor families aren’t completely immune to cross sensitivities. NDIR CO₂ sensors can be affected by humidity and temperature. PM sensors can show false spikes from fog, steam, or high humidity. MOS sensors drift as their reactive layer ages. No sensor is perfectly isolated.
Myth: A $1000 Monitor Is Automatically More Accurate Than a $200 Monitor
After everything we’ve covered so far it probably won’t come as a surprise that a higher price tag doesn’t automatically guarantee higher accuracy. It sounds intuitive that a $1000 monitor must outperform a $200 one, but once you start opening devices, testing them side by side, and comparing their data to reference instruments, the assumption falls apart quickly.
Most consumer monitors, regardless of price, rely on the same underlying sensor modules from the same small group of manufacturers. A premium monitor can be built around the exact same Plantower PMS sensor, the same Cubic NDIR CO₂ sensor, or the same Sensirion gas sensor as an affordable device. Without proper calibration or altered firmware handling, those sensors will behave almost identically across devices. Sometimes, the cheaper device can actually outperform the expensive one simply because it's been calibrated by the manufacturer or the firmware works better for that sensor type (such as taking more frequent readings).
The base accuracy of a monitor is set by the sensor module, not the price of the enclosure around it. What can justify a higher-priced monitor is additional testing, individual calibrations, better environmental handling, improved firmware, or specialised capabilities - but none of these are guaranteed just because the device costs more. Some expensive monitors invest heavily in display quality, cloud platforms, or industrial casings, while leaving the sensor performance untouched.
And even when a brand does add extra QA or batch calibration, the improvement is usually incremental, not dramatic. A well-calibrated $200 monitor using a solid PM sensor can often outperform a poorly validated $1000 monitor that uses the exact same module but applies the wrong correction curve or ignores environmental effects. For this reason, price simply isn’t a reliable predictor of accuracy. Instead, look into how the company calibrated its devices.
Myth: Reference Monitors Are Always Accurate
After looking at consumer monitors, it’s natural to assume that at least reference monitors - the large, expensive, regulatory-grade instruments used by governments and research institutions - must represent the “true” concentration in the air. These devices are often used as the benchmark in studies comparing low-cost sensors, and they typically cost anywhere from $20,000 to $100,000. Because of this, many people understandably see them as infallible and assume their readings are the ultimate ground truth.
However, the reality is more nuanced. First, “reference monitor” is not a single category. There are Federal Reference Method (FRM) instruments and Federal Equivalent Method (FEM) instruments, and they rely on very different measurement principles. For example, beta attenuation monitors (BAMs) measure particle mass by detecting changes in radiation absorption on a filter, while regulatory-grade optical counters use laser scattering to infer mass from light interactions. These instruments behave differently under different conditions: BAMs often show more noise at low concentrations, while optical methods can struggle with high concentrations or particle types that absorb light strongly, such as soot.
Complicating things further, reference instruments still depend on calibration choices, aerosol type, and assumptions about particle density and refractive index - the very same limitations that affect low-cost sensors. A BAM calibrated on one aerosol type may behave differently when the ambient particle mix changes. Optical FEMs can shift noticeably depending on humidity or aerosol composition. Even things like maintenance intervals also influence accuracy.
When two reference instruments sit side by side, it’s not uncommon to see 10–30% differences between them, even though both are performing within specification. This isn’t a sign of failure but instead it’s a reflection of the fact that no instrument measures “true PM₂.₅.” They each measure PM₂.₅ according to their approved method, but each method still has its own strengths and blind spots.
So yes, reference monitors are the closest thing we have to a trusted standard. They are well-characterised, stable, and proven in regulatory environments. But even they operate within a world of assumptions, calibration decisions, and environmental constraints. Instead of thinking of reference monitors as perfectly accurate, it’s more accurate to treat them as the most reliable starting point, not an absolute truth.
Conclusion
If this article makes air quality monitoring sound complicated, that’s because it is complicated. Each myth on its own might seem harmless, but when you combine them and they compound, they can seriously reduce how useful a monitor is in practice. The devices themselves aren’t the problem; it’s the layers of misunderstanding that build up around them.
These issues are exactly why we’ve chosen to approach things differently. We design and build our monitors ourselves, test every sensor, document our calibration procedures, and work closely with researchers who help us validate and continually improve our methods. Our hardware and firmware are open source because transparency is the only way users can truly know what their device is doing and where its limitations lie. And importantly, we focus exclusively on air quality monitors. We know how much work it takes to make these devices accurate and trustworthy, and splitting our attention across unrelated products would compromise that.
If there’s one takeaway from everything discussed here, it’s this: transparency is what makes air quality monitoring trustworthy.
Image Sources:
(a) Agglomerate of soot particles adapted from Li et al., CC BY 4.0.(b) Asbestos fibres adapted from Schneider et al., CC BY 4.0.(c) Asbestos fibers lying on a larger particle released during sawing of a floor tile. Adapted from Ervik et al., CC BY 4.0.(d) Sea salt particle (Na2SO4) adapted from Dang et al., CC BY 4.0.(e) Fungi spore adapted from Valsan et al., CC BY 3.0.(f) Chloride-rich mineral dust adapted from Morantes et al., CC BY 4.0.(g) Salmonella bacteria adapted from Golding et al., CC BY 4.0.(h) Flour adapted from RodrÍguez-Lora et al., CC BY 4.0.(i) House dust adapted from Flickr, CC BY 2.0.