If you look at an air quality map of India, you’ll find that the map looks completely different depending on whether you’re in India or the US. This stems from the major disparities that exist between national air quality indices (AQIs), which use different categorization labels, benchmarks, and colours to denote air quality.
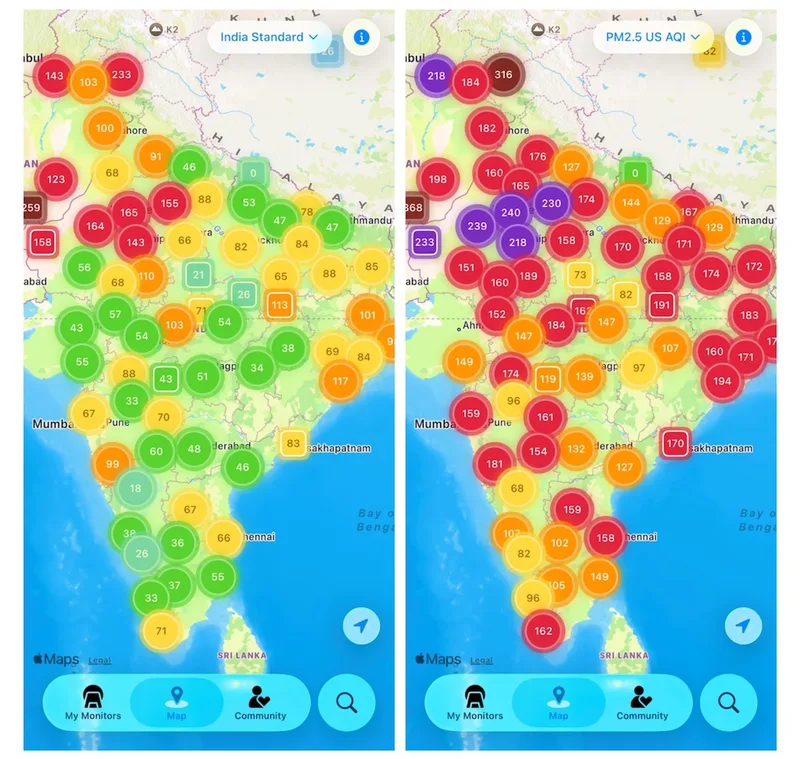
*Metrics differ: left shows PM2.5 concentration (µg/m³); right shows AQI index values
India’s National Air Quality Index (NAQI), as seen above on the left, reveals mostly green and yellow clusters, representing “satisfactory” and “moderate” air. For the same exact clusters measured in the same period, using the US Environmental Protection Agency’s (EPA) AQI, seen on the right, will show mostly orange and red. These represent “unhealthy for sensitive groups” or generally “unhealthy” air, signalling a significantly higher level of concern.
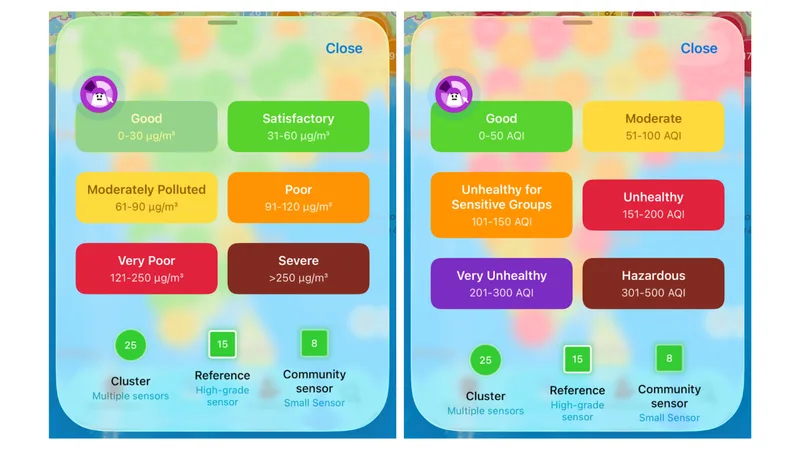
Here we can see the difference between the categories of these two AQIs – India’s NAQI on the left, and the US AQI on the right. NAQI’s “good” and “satisfactory” standards cover two separate categories, seen here on the AirGradient map legend in two shades of green. For those without a careful eye for detail, this can make a “satisfactory” cluster be mistaken for a “good” one.
This further highlights the difficulty of comparing cross-country indices; greens, oranges, and reds don’t automatically correspond, and can even be split within one index.
AQI disparities across countries
In its 2021 air quality guidelines, the World Health Organization (WHO) says that a 24-hour average PM2.5 concentration above 15 micrograms per cubic metre (µg/m3) is already beyond its recommended limit. India’s system, in contrast, sets the comparable 24-hour threshold of PM2.5 at 60 µg/m3, which is four times higher.
However, India is far from being alone in exceeding this limit. China sets its limit at 75 µg/m3, the European Union at 50 µg/m3, the US at 35 µg/m3, and Canada at 28 µg/m3, just to name a few.
From a health perspective, the implications are striking: two people breathing air with the same level of PM2.5 in two different countries could be told very different stories about how safe that air is. This gap silently shapes how millions of people understand the air they breathe, and can influence the activities they undertake in their day-to-day lives. For example, recommendations related to prolonged and strenuous outdoor activities are particularly important, seeing as exercise poses additional health risks due to the increased uptake and deposit of pollutants in the lungs.
After all, WHO guidelines remain advisory, and hence, governments have no legal obligation to abide by them. However, they are formulated by expert committees with the aim of informing local policymaking.
Why do national standards differ so drastically from the WHO recommendation?
Firstly, there’s a technological disparity to note, as countries use different types of reference grade monitors as the ‘official’ norm, which measure air pollution differences. India’s official monitors use beta attenuation monitors (BAMs), which physically weigh particles and require regular maintenance and biyearly calibration, whereas many private platforms use low-maintenance sensor-based devices that rely on laser scattering. BAMs are more accurate and better suited for measuring higher concentrations, which fits with India’s local context. However, without the regular maintenance required, this advantage may be negated, and the accuracy of the data reported may in fact suffer.
According to Gufran Beig, founder director of India’s national air quality monitoring system SAFAR, “every country has built its index based on its own adaptability, weather and local environment”. India’s Northern Plain, for example, experiences natural dust storms. These increase both coarse and fine particulate matter concentrations in the ambient air, which cause conditions to exceed the WHO limit. Adopting this standard in these locations would classify air as polluted even without human activity.
The Indian Environment Ministry raises another point regarding the need to account for “socio-economic status and national circumstances”. While the country is striving to transition towards cleaner alternatives in accordance with the National Action Plan on Climate Change, most of the energy consumed in India is derived from fossil fuels, particularly coal. Meanwhile, the combustion of coal, petrol, diesel, gas, biomass, and waste accounts for 81% of PM2.5 pollution. Therefore, reducing air pollution would logically entail targeting this sector. If India were to strictly adhere to international standards, it would require an overhaul of its energy production systems, transportation, and construction, and would incur significant job losses in the fossil fuel sector. This would impact economic growth and development goals, yielding social and political challenges.
A uniform standard vs. national flexibility
Should there be a standardized international index, or should we allow for cross-country variation?
On one hand, a stricter index aligned with WHO limits might better reflect health risks and allow for comparable scales, but would expose the severity of a problem that is expensive and politically costly to fix. On the other, a looser index can account for local contexts, and reduce public alarm and short-term political pressure. However, this may come at the cost of long-term passivity.
At AirGradient, we are grappling with this question ourselves. On our mobile app, which features a map that visualizes real-time air quality data, users can select to display values either as raw concentration values (µg/m³) or using the U.S. EPA Air Quality Index (AQI) scale.
Should we also integrate other national indices such as India’s NAQI? This would allow us to reach a larger audience and adapt to what users are familiar with, but would also mean shaping norms towards an acceptance of indices that may be misinforming their users of the real health risks.
You can download the AirGradient map and test out the index displays here: App Store / Play Store
REFERENCES
Central Pollution Control Board. (2025). National Air Quality Index. Ministry of Environment, Forest and Climate Change, Government of India. https://cpcb.nic.in/National-Air-Quality-Index/
U.S. Environmental Protection Agency. (2024). PM NAAQS air quality index fact sheet. https://www.epa.gov/system/files/documents/2024-02/pm-naaqs-air-quality-index-fact-sheet.pdf
World Health Organization. (2021). WHO global air quality guidelines: Particulate matter (PM2.5 and PM10), ozone, nitrogen dioxide, sulfur dioxide and carbon monoxide. https://www.who.int/publications/i/item/9789240034228
Ghosh, B., De, A., Seth, M., et al. (2026). Evaluating the national burden of PM2.5 in India: A comprehensive study of spatiotemporal distribution at state and city levels, non-carcinogenic health hazards, and premature mortality. Environmental Monitoring and Assessment, 198(43). https://link.springer.com/article/10.1007/s10661-025-14860-3
Pandey, S. P., Pokharel, A. K., & Peng, Z. (2025). Reoccurrence of dust storms in South Asia and their implications for vegetation health. Integrative Conservation, 4, 362–380. https://onlinelibrary.wiley.com/doi/full/10.1002/inc3.70036
Hahad, O., Kuntic, M., Frenis, K., Chowdhury, S., Lelieveld, J., Lieb, K., Daiber, A., & Münzel, T. (2021). Physical activity in polluted air—Net benefit or harm to cardiovascular health? A comprehensive review. Antioxidants, 10(11). https://pmc.ncbi.nlm.nih.gov/articles/PMC8614825/
Yadav, N. (2025, November 16). Why India caps pollution reading at 500 when the air is far more toxic. BBC News. https://www.bbc.com/news/articles/ced6jgg0180o
System of Air Quality and Weather Forecasting and Research. (n.d.). SAFAR India. Ministry of Earth Sciences, Government of India. https://safar.tropmet.res.in/
Mohan, V. (2025). We don’t go by external ranking on climate, pollution: Govt. The Times of India. https://timesofindia.indiatimes.com/india/we-dont-go-by-external-rankings-on-climate-pollution-govt/articleshow/125920891.cms
Prajapati, P., Guo, R., Cai, A., & Prasad, R. (2025). Navigating the energy transition in India: Challenges and opportunities towards sustainable energy goal. Water–Energy Nexus. https://www.sciencedirect.com/science/article/pii/S2588912525000190