When we talk about air pollution, we usually talk about its negative health impacts – asthma, respiratory illnesses, and the hospital visits that follow – but much less about what it costs us economically. According to the World Bank, air pollution causes economic losses equivalent to nearly 5% of global GDP each year through healthcare costs, reduced productivity, and shortened life expectancy. Despite this, the financial toll of polluted air remains largely absent from discussions about air quality.
Recognizing this disconnect, more countries are beginning to ask a different question: what does it already cost us to do nothing? It may sound rhetorical, but there is now a structured way to answer it. This approach, known as assessing the cost of inaction, reframes air pollution as something with measurable economic, social, and health consequences. And once those consequences can be measured, they become much harder to ignore.
What the cost of inaction means in the context of air pollution
In its simplest form, the cost of inaction measures the losses that occur when no additional steps are taken to reduce air pollution. It accounts for the health impacts, economic and environmental damages, and the benefits that are missed when cleaner policies are not adopted.
But perhaps the most useful thing about the concept is that it challenges an old assumption: that investing in cleaner air is costly, and that not acting carries no financial consequence. In reality, doing nothing has a price tag, and it is often higher than the cost of implementing cleaner alternatives.
This flips the traditional narrative. Instead of asking, “How much will mitigation cost?” we begin asking, “How much are we already losing by not acting?” This shift alone can open doors that have been stuck for years.
How is the cost of inaction calculated?
This shift in perspective – from asking how much action will cost to asking how much inaction already costs us – has created a growing need for tools that can quantify those losses in a credible way. That’s where the International Institute for Applied Systems Analysis (IIASA)’s Guide to Assessing the Costs of Inaction of Tackling Air Pollution comes in.
The guide provides a detailed framework for how an assessment team can carry out a cost of inaction assessment using rigorous scientific methods and the best available data.
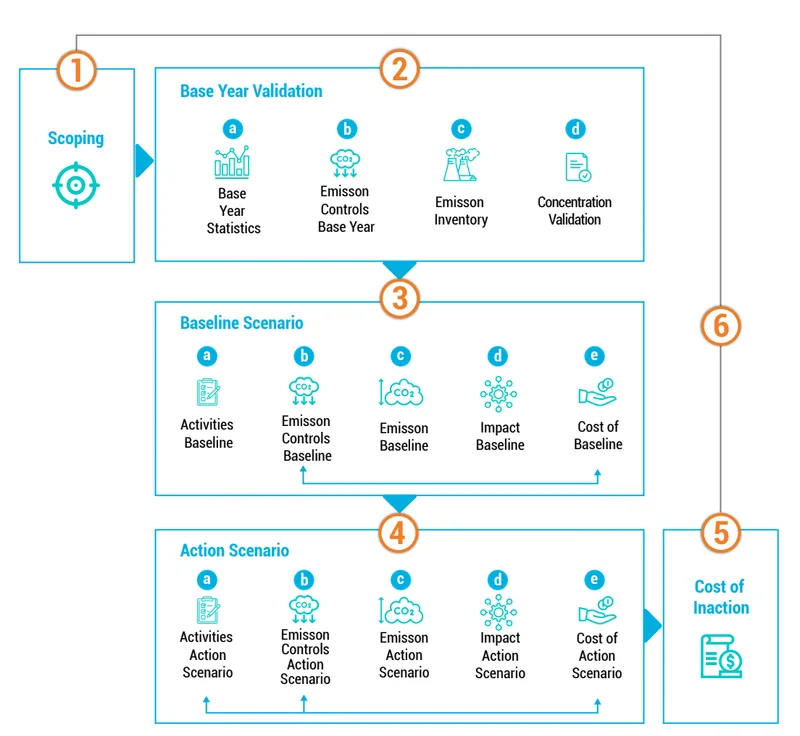
The assessment is broken down into six phases:
Phase 1: Determine the scope of the analysis
The first phase is about setting the boundaries of the assessment, or deciding what it should cover and what questions it needs to answer. This is where countries identify the main impacts they want to examine (such as health, productivity, or climate-related effects), the pollutants of interest, and the types of future policies they want to compare.
It also involves bringing the right people into the process early on. Different ministries, researchers, and technical experts hold different pieces of the data and insight needed. Agreeing on the goals of the assessment, the roles of each stakeholder, and the modelling tools that will be used ensures that the analysis is focused, realistic, and aligned with national priorities.
Phase 2: Quantify and validate emissions in the base year
Before looking into the future, the guide recommends grounding the assessment in an accurate snapshot of the present. This means gathering data on current emissions, pollution levels, population exposure, and health outcomes for a recent “base year.”
Models and monitoring data are then compared to check whether the estimated pollution levels match what is actually measured on the ground. This step may sound technical, but it serves a simple purpose: making sure the starting point is solid. Once this base year is validated, it becomes the foundation for all future projections.
Phase 3: Development of a Baseline scenario
In this phase, teams create a picture of what the future looks like if no new clean-air measures are introduced. The guide breaks this into several steps: choosing the right models and activity data, identifying existing policies, calculating future emissions under those policies, and estimating the resulting pollution levels, health impacts, and even the monetized costs of those impacts.
The goal is not to predict the future perfectly, but to build a grounded, evidence-based reference point. This baseline eventually becomes the anchor for comparing any alternative action scenario.
Phase 4: Development of an alternative action scenario
After establishing the baseline, countries create an action scenario. This scenario includes additional measures the country might adopt, such as cleaner fuels, stronger emission standards, or better enforcement.
Using the same modelling framework as the baseline ensures that both futures can be compared fairly. This scenario helps illustrate how much emissions could drop, how pollution levels might improve, and how those changes would affect health, productivity, and the environment.
In other words: If we did take action, what improvements could we reasonably expect?
Phase 5: Cost of Inaction as Difference
When the baseline and action scenarios are placed side by side, the difference between them becomes the cost of inaction.
This difference reflects avoidable losses: premature deaths or illnesses that wouldn’t occur under the action scenario, work days that could have been saved, and crops that wouldn’t be damaged.
When these differences are translated into monetary terms, they show what a country continues to pay by following its current path rather than adopting additional measures.
Phase 6: Iterate and refine
The guide emphasizes that this process is not a one-time calculation. As new data becomes available (whether in the form of updated monitoring, new census numbers, or revised national policies), the assessment can be revisited and improved.
This flexibility is important, as it allows the cost of inaction to remain relevant over time and ensures the results match a country's changing realities and priorities.
How this helps countries understand what action is worth
For policymakers juggling factors such as poverty, economic growth, and infrastructure, air quality can feel abstract or secondary. The cost of inaction assessment changes that by turning something vague into something concrete: here's what we're already losing, here's the long-term economic drag of polluted air, and here's what we could gain by implementing specific measures.
More importantly, these assessments allow for comparison. A country can weigh the cost of installing cleaner technology or funding monitoring networks against the losses those investments would prevent. It doesn't oversimplify the decision, but it does make the trade-offs visible. It brings air quality into the language that ministries of finance, health, transport, and planning can all work with.
This becomes even clearer when you look at places where the effects are already visible. In the Philippines, where I live, the economic burden of air pollution shows up in healthcare costs, lost productivity, and everyday exposure. In a report by Greenpeace titled Toxic Air: The Price of Fossil Fuels, it is estimated that the Philippines loses the equivalent of up to 1.9% of its GDP every year due to air pollution. That number is difficult to ignore when you start asking practical questions such as: What could 1.9% of GDP support if it weren’t being absorbed by preventable impacts? Schools, public transport upgrades, healthcare, community infrastructure – the opportunity cost is enormous.
I wrote previously about how air pollution shapes daily life in Metro Manila, and the cost of inaction gives another layer to that reality: it quantifies what people already feel. But this isn’t something unique to the Philippines. Countries across ASEAN, South Asia, Africa, Europe, and North America face their own economic losses from polluted air. The pattern is the same no matter the region: when pollution rises, countries end up bearing the cost in their national budgets and in people’s daily lives.
A tool that opens the door to the next question
Cost-of-inaction assessments help make the scale of current losses visible, but they are still only one part of the picture. Knowing what we stand to lose is an essential starting point – the next step is understanding the range of futures that become possible when different policy choices are made.
While the assessment framework by IIASA already compares a baseline with an action scenario, newer simulation tools build on this by allowing countries to explore a wider set of policy pathways and see their effects in more detail. These platforms help visualize how air quality, public health, and economic outcomes might shift under different combinations of measures, giving governments a clearer sense of the trade-offs and opportunities ahead.
This will be the focus of the next article in this series: a closer look at the growing landscape of air quality simulation platforms, and the people behind them.
References
Greenpeace. (2020). Toxic air: The price of fossil fuels. Greenpeace Southeast Asia. https://www.greenpeace.org/static/planet4-southeastasia-stateless/2020/02/21b480fa-toxic-air-report-110220.pdf
International Institute for Applied Systems Analysis. (2023). Guide to assessing the costs of inaction of tackling air pollution. IIASA. https://pure.iiasa.ac.at/id/eprint/18827/1/Guide%20to%20Assessing%20the%20Costs%20of%20Inaction%20of%20Tackling%20Air%20Pollution-IIASA%20-%20Advance%20copy-May2023-f.pdf
World Bank. (2023). Accelerating access to clean air on a livable planet. World Bank Group. https://documents1.worldbank.org/curated/en/099032625132535486/pdf/P502230-d16d0858-2e18-41df-a7a6-f1188121ac83.pdf