Open and Accurate Air Quality Monitors
We design professional, accurate and long-lasting air quality monitors that are open-source and open-hardware so that you have full control on how you want to use the monitor.
Learn MoreTens of thousands of people worldwide are now monitoring air quality in their own neighborhoods with AirGradient monitors, transforming hyperlocal air quality from a mystery into quantifiable data. AirGradient's API and Open Data Licensing are enabling a thriving ecosystem of third-party applications.
An example is Local Haze - an iPhone and Apple Watch app that brings crowdsourced air quality data to your pocket. Drawing from real-time readings aggregated from citizen scientists across six continents, Local Haze delivers easy-to-understand air quality information wherever you are. The Local Haze app is the kind of community-powered innovation we envisioned: thousands of neighborhood sensors, making invisible air data around us measurable, accessible, and understandable by everyone.

Earlier this year, I met Karen and Craig, the team behind the Local Haze app. Their goal with Local Haze is to make air quality data accessible and easy to understand for as many people as possible. They had just added support for AirGradient monitors, and I wanted to open a dialogue with them because they are both very active in the air quality monitoring space and believe in the power of citizen science. What I expected to be a quick chat turned into a much longer conversation about local air quality, collecting reliable data, and translating it into something both easily accessible and understandable. It was quickly obvious that Karen and Craig weren’t just building an app; they were translating complex air-quality data into something ordinary people could actually understand and use.
After we first connected, we ended up doing an interview for the Local Haze blog. That was my first real glimpse into how deeply Karen and Craig think about design, data transparency, and helping citizen scientists make sense of what’s happening in their own neighborhoods. To be honest, when I first saw the questions, I was both surprised and excited by the depth and thought that had gone into them (and some of the questions were quite challenging to answer!). The questions alone showed just how knowledgeable and passionate the Local Haze team is about air quality.
Since the initial interview articles, we’ve continued to work closely with Karen and Craig, and today I wanted to use this post to properly introduce them: who they are, how they came to care so much about air quality, and how that eventually led to the Local Haze app. I’ll also share a bit about what they’re working on next, because the direction they’re heading is exciting - not just for Local Haze, but for anyone interested in accessible, community-driven environmental monitoring.
Karen and Craig have been designing, building, and launching technology products long before Local Haze existed. Both are principals at HumanLogic, a product design and engineering consultancy whose worldwide clients include Google, VMware, Amazon, T-Mobile, and a range of early and growth-stage startups. Karen is a former cell phone designer (she worked on the Motorola Razr2), and Craig co-founded and sold a mobile operating system software company in Boston. HumanLogic also develops its own products, including Local Haze.
Neither Karen nor Craig started in environmental science. Their interest in air quality grew from a mix of personal curiosity, everyday frustration, and the realization that while massive amounts of air-quality data exist, very little of it is designed for regular people. That shared curiosity eventually led them to ask a simple question: What’s actually in the air around us, and why is it so hard to understand?
Karen’s interest in air quality began in a very personal way when she was prescribed an inhaler for asthma symptoms and suddenly found herself wondering what exactly she was breathing every day. Like most of us, she already carried her phone everywhere, and the idea of needing to buy and carry yet another device just to understand her local air felt unreasonable.
So she did what good designers do: she started talking to people. She interviewed others with similar concerns, parents, runners, people with asthma (and their caretakers), and people living near industrial areas. She found that many shared the same frustrations. They cared about air quality, but the tools available were either too technical, too expensive, or too disconnected from real-life moments when someone might actually need that information.
Craig came into the picture from a complementary angle. As an engineer, he has spent his career building systems that turn messy data into something useful. When Karen started investigating what it would take to make air-quality information more accessible to the non-scientist end user, Craig dug into the sensor networks, APIs, and data sources behind the scenes. He quickly saw how fragmented everything was. Different sensors reported in different formats, many didn’t indicate the trustworthiness of their readings, and the data was scattered across agencies and communities worldwide.
Together, they realized two things:
That combination of curiosity, frustration, and opportunity shaped the earliest idea of what would eventually become Local Haze: a simple, mobile, “on-the-go” way to understand air quality without needing a technical background in the field.
Once Karen and Craig realized how hard it was for everyday people to interpret air quality data, the idea for an app started to take shape. Could they take all this complex data and turn it into something that makes sense instantly?
Craig got to work on the data side, pulling in readings from crowdsourced networks like PurpleAir and Sensor.Community, alongside government sources such as AirNow. Once the data had been aggregated and optimized for mobile access, they quickly hit a core challenge: the data didn’t always agree with itself. Some sensors were extremely accurate while others were questionable at best. On top of this, most apps at the time simply displayed numbers without explaining how they were processed or their reliability.

That’s where one of Local Haze’s most important features came from: confidence ratings. Instead of pretending all air quality readings are equal, the app openly shows how trustworthy each sensor’s data appears to be. That bit of transparency became a foundation of the whole experience, and it’s easily my favourite feature of the app.
Karen and Craig took a human-centric design approach to developing and launching Local Haze, understanding that it is not about the numbers, but about how your product offering fulfills use cases for people. For their initial product launch, the Local Haze app aimed to solve a simple use case: for a user with an air quality concern (such as an asthma sufferer), can the app answer the question “Is it OK for me to go outside now?”
They started small. Karen drafted a persona she called the “Air Quality Enthusiast”- someone curious about the air around them but not a scientist, someone who wanted quick answers without carrying extra equipment. She set about validating the persona hypothesis through interviews. She then mapped out what that person might need, what would confuse them, and what would help them trust the information they were seeing.
Example design artifacts from the Local Haze development process: A: User-Centered Design (UCD) process diagram, B: Prioritization criteria for new features, C: An example persona for an Air Quality Enthusiast and D: A user journey map for an early iteration of the mapping feature.

With the user research data and the use case planning pieces in place, Karen started shaping the app’s visual language using clear colors, simple faces, and a design that delivers the most important information the moment you open it.
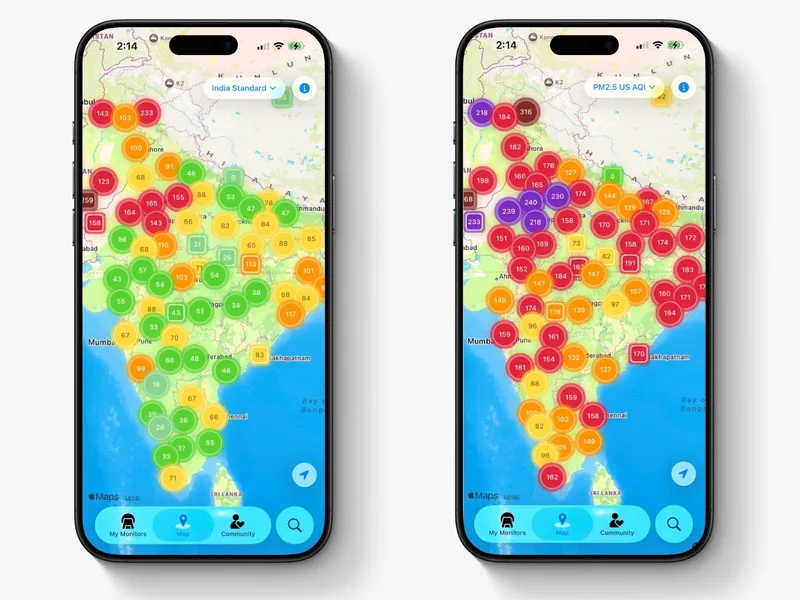
They worked in short, iterative sprints, incrementally building and refining the experience based on user feedback. When Local Haze launched on the App Store, something clicked: citizen scientists, environmental groups, and everyday users embraced it. Over time, the app expanded to more than 33,000 sensors across six continents and earned a 4.6-star rating.
Unlike physical products, mobile software is never complete. Users are constantly updating their devices and new air quality monitors are always coming online. This leads to a continuous need to evolve the software over time. When a new feature is added to Local Haze, it is carefully planned and tested for performance and to deliver user value.
Early features, such as the scrolling list of air quality sensors, became unusable as the number of sensors scaled. This led to both the introduction of the favorite sensors feature, and additional functionality to allow users to search for specific sensors by location and name.
Even the map feature, which allows for “at-a-glance” understanding of air quality for a geographic region, required substantial changes to cluster and summarize individual sensors to avoid impacting the performance of the pinch & zoom navigation gesture on the iPhone.
Users' devices have also changed with larger phones, smaller widgets and even smart watches that have been introduced in recent years. Designing for the small display surface on the Apple Watch has meant paring back to the essential data that must be presented in small chunks to be understood at a glance.

Even though Local Haze has grown into a global utility used by many thousands of people, Karen and Craig aren’t treating it like a finished product. If anything, they’re thinking more about the future of air-quality awareness now than when they started.
Moving beyond the traditional “dashboard” model in the application, ideas are being explored on how to communicate to non-technical users both the acute (short-term) and chronic (long-term) impacts of air quality. In the short term, air quality has acute health impacts, such as (often slightly delayed) triggering of asthma, so users should know when to adapt the timing of outdoor activities or when to close windows that are ventilating indoor spaces. On the other hand, the long-term chronic impacts, which governments generally focus regulation on, are not as directly controllable by users and require lobbying the powers that be when the trends are not improving.
The Local Haze team has, over recent years, worked to expand the coverage of local air quality monitoring by leading discussions within technical groups such as the MIT Alumni Club and with University students. With the availability of air quality monitoring kits, the team is looking to other groups, such as the “maker” communities, and is planning an upcoming video review of the AirGradient Open Air kit.
And then there’s their broader advocacy work. Karen and Craig are spending more of their time speaking, writing, and connecting with communities that are building their own monitoring networks. Karen and Craig have given presentations at organizations such as AARP to help spread low-cost sensors across neighborhoods, schools, and cities. Recently, this work has expanded to include local community press articles.
Karen and Craig’s efforts to develop Local Haze and raise awareness of air quality monitoring empower individuals to take control of their local environments. They have made it easier for everyday citizens to participate in this important cause, becoming informed and engaged about the air they breathe.
AirGradient’s commitment to making local air quality data accessible via an open API underscores the value of citizen science in fostering a healthier world. The API does more than provide data. Rather, it enables an entire ecosystem of air quality innovation. By making monitoring accessible to developers, researchers, and everyday citizens, we have helped lay a foundation for third-party apps, community projects, and local initiatives to flourish.
Together, we can harness the power of community involvement and citizen science to foster cleaner air and a safer planet for all.
Download Local Haze for free on the Apple App Store and find more about Local Haze on the web.

We design professional, accurate and long-lasting air quality monitors that are open-source and open-hardware so that you have full control on how you want to use the monitor.
Learn MoreCurious about upcoming webinars, company updates, and the latest air quality trends? Sign up for our weekly newsletter and get the inside scoop delivered straight to your inbox.
Join our Newsletter