Accuracy is not just one feature among many when it comes to air-quality monitors, rather, it is the feature. These devices exist for a single reason: to tell you what is in the air you are breathing. If the numbers presented are wrong, even by a modest amount, the device can become misleading. That makes choosing an air-quality monitor fundamentally different from choosing most other types of consumer technology.
The problem is that accuracy itself is not easy to judge. Unlike battery life or screen size, you can’t verify it by looking at a spec sheet or reading a handful of user reviews. As a result, many people turn to independent testing databases to help decide whether a monitor can be trusted. Platforms such as AQ-SPEC have become a go-to resource for comparing sensors and assessing how well they perform against reference instruments.
In doing so, however, these comparisons often hinge on a single headline number: R², the coefficient of determination. It appears in tables, charts, and summaries, and is frequently interpreted as a quick measure of how “good” or “accurate” a sensor is. A value close to 1.0 looks reassuring while a lower value raises doubts.
The trouble is that R² does not measure accuracy at all. It measures correlation and confusing these two can lead to flawed conclusions about sensor performance.
At a basic level, R² describes how well two datasets move together over time. If pollution levels rise and fall in sync between two instruments (typically a low-cost sensor and a reference monitor) R² will be high. But this says nothing about how close the actual values are. A sensor can consistently overestimate or underestimate PM2.5 concentrations and still achieve an excellent R², as long as it follows the same ups and downs as the reference.
Accuracy, by contrast, is about agreement - how far the sensor’s readings deviate from the true value. R² was never designed to capture that, yet it is often interpreted as if it does.
Correlation and Accuracy Are Not the Same Thing
You might think we’re just being pedantic, but in practice, this can make a huge difference. In air-quality monitoring, accuracy matters because measurements are used to assess exposure, inform policy, and communicate risk. A sensor that consistently reports PM2.5 values 30 percent too high might still show an R² of 0.95 or higher if it responds well to temporal changes. From a correlation standpoint, it looks excellent. From an accuracy standpoint, it is clearly not.
R² is therefore best understood as answering a narrow question: do two instruments respond to pollution changes similarly? It does not answer how right (or wrong) the sensor is, how biased it may be, or whether the data are suitable for quantitative use.
Why R² Depends on More Than Sensor Performance
One of the least intuitive aspects of R² is that it depends just as much on the behavior of the reference data as it does on the sensor being evaluated. In colocated measurements, R² is influenced by two independent factors: how closely the sensor agrees with the reference, and how much the reference concentration varies over time.
This second factor is often overlooked. When PM2.5 concentrations fluctuate widely (for example during wildfire smoke events) the variance of the reference signal is high. In these situations, R² tends to increase, even if the sensor’s absolute errors remain unchanged. When concentrations are stable and vary only slightly, R² often drops, sometimes dramatically.
This means that R² can improve simply because the air got more variable (there was a wider range of PM2.5 concentrations measured), not because the sensor got better.
Same Sensors, Same Data, Very Different R²
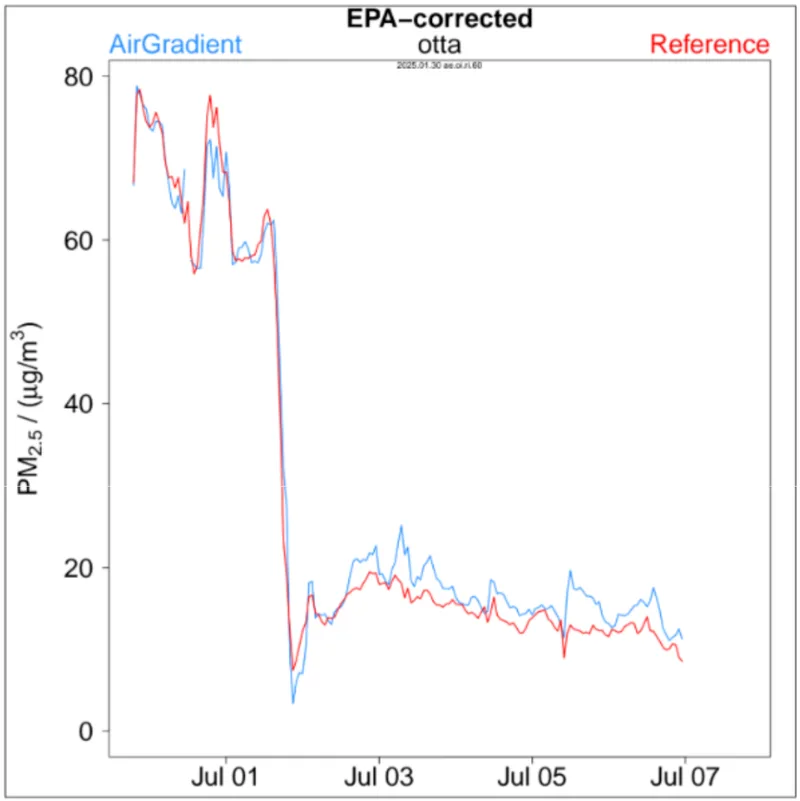
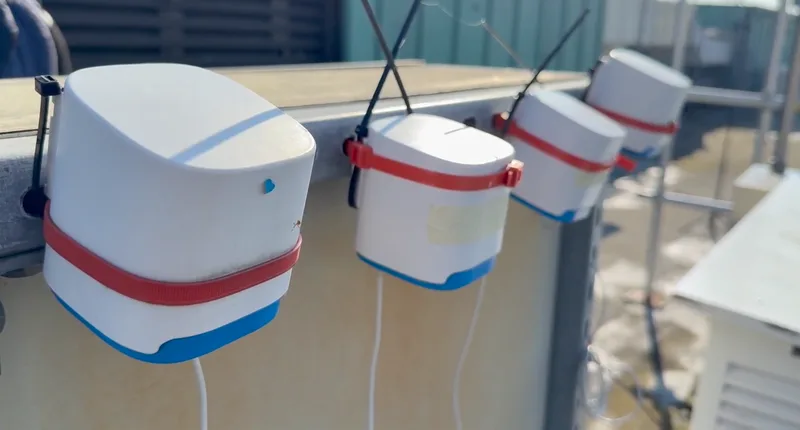
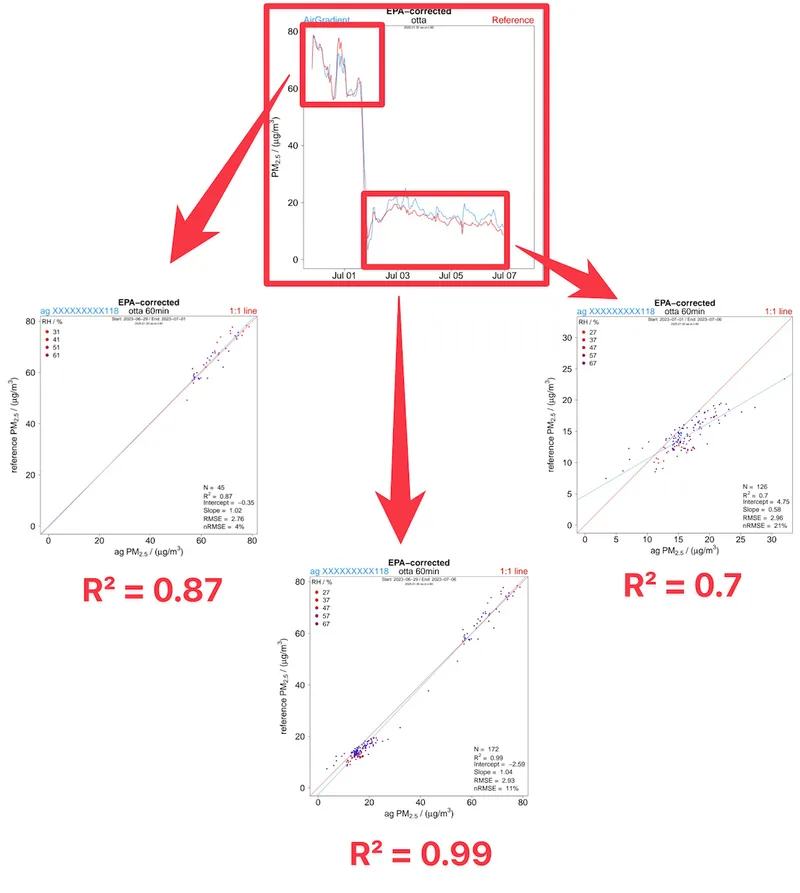
This effect is easy to demonstrate with real-world data. In one colocation study from Ottawa, Canada (shown above), we compared PM2.5 data from an AirGradient Open Air against a federal equivalent method reference instrument using hourly averages and a standard EPA correction. When the entire measurement period was analyzed as one, the resulting R² was 0.99 - a near-perfect result by conventional standards.
However, when the exact same dataset was split into two shorter time periods - one for the period with high concentrations and one for the period with a lower concentration - the R² values dropped to 0.87 and 0.70 respectively.
Nothing about the sensors changed. Nothing about the reference changed. The only difference was the concentrations within each time window. Since the combined dataset spanned a wider concentration range, the R² value became inflated.
This illustrates a fundamental limitation of R²: it cannot be meaningfully compared across different tests unless concentration ranges and variability are similar. If you want to read more on this topic, Clarity published a very helpful post.
Why Low R² at Low Concentrations Is Often Misleading
Another issue highlighted in the example above is that R² tends to behave worse at low or stable pollution levels. Low R² values are often taken as evidence that sensors perform poorly in clean environments, but in many cases the opposite is true. When concentrations are relatively stable and confined to a narrow range, R² becomes a much poorer indicator of how well two instruments agree.
Consider an environment with a true PM2.5 concentration of around 50 µg/m³. If a sensor fluctuates randomly by plus or minus 1 µg/m³ around that value, its agreement with a reference instrument is excellent, corresponding to an error of only about two percent. Yet because the concentration range is so narrow, the resulting R² can be very low. The statistic suggests poor performance when, in reality, the sensor is performing very well.
This is why datasets from clean or stable environments often produce lower R² values, even when sensors are accurate. In these cases, R² is responding primarily to the lack of variability in the underlying concentrations, not to large measurement errors.
Metrics That Actually Reflect Accuracy
So what is the ideal way to compare air-quality sensors? If R² doesn’t tell us much about accuracy, what should we be using instead?
Unfortunately, there isn’t a single “best” metric. Every statistical measure has limitations, and each one highlights only a specific aspect of sensor behavior. Error-based metrics such as RMSE, normalized RMSE (nRMSE), MAE, and normalized MAE (nMAE) are sometimes more useful than R² because they describe errors in physical terms (how far a sensor’s readings are from a reference, on average).
But these metrics are not flawless either. Some perform poorly at low concentrations, where very small absolute differences can produce deceptively large relative errors. Others can hide systematic bias or fail to capture whether a sensor responds correctly to short-term pollution events. In many ways, their weaknesses are almost the inverse of R²: where R² breaks down when concentrations are stable, some error-based metrics struggle when concentrations are low.
This is why meaningful sensor evaluation can’t be reduced to a single headline number. A full picture only emerges when multiple metrics are considered together and interpreted in context - alongside concentration range, variability, and the intended use of the data.
The Role of R² in Sensor Evaluations
R² is not useless, but its role is limited. It is helpful for checking whether a sensor responds to pollution changes at the correct time and whether its output is suitable for correction or calibration. A reasonable R² is often a prerequisite for further analysis. However, problems arise when R² is treated as a standalone measure of performance or accuracy, or when values are compared across tests without sufficient context.
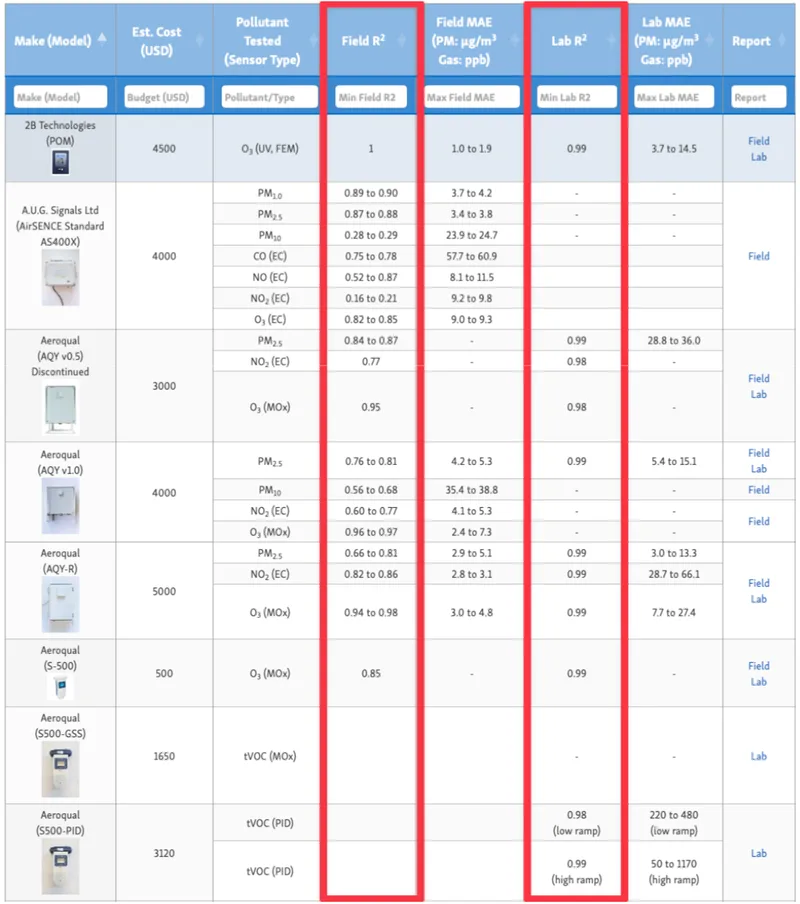
This issue is particularly visible in widely referenced evaluation platforms such as AQ-SPEC. AQ-SPEC plays an important role in standardized sensor testing and, importantly, conducts both laboratory and field evaluations. The laboratory tests are inherently more comparable across sensors, as they expose all devices to the same, deliberately wide PM2.5 concentration range (usually around 0-300µg/m³). Unsurprisingly, R² values from lab tests tend to be consistently high - almost always higher than those from outdoor testing - largely because the wide concentration range strongly favours high correlation.
Outdoor tests tell a very different story. Sensors are evaluated at different times, under different meteorological conditions and aerosol compositions. In this context, R² values are strongly influenced by the specific pollution patterns during the test period. Much of what outdoor R² captures reflects uncontrolled environmental variability rather than intrinsic sensor behaviour. From a correlation standpoint, this additional information is of limited value, since sensor response is already well covered by laboratory testing. What outdoor tests are uniquely suited to assess is accuracy under real-world aerosol conditions - something R² is not designed to describe.
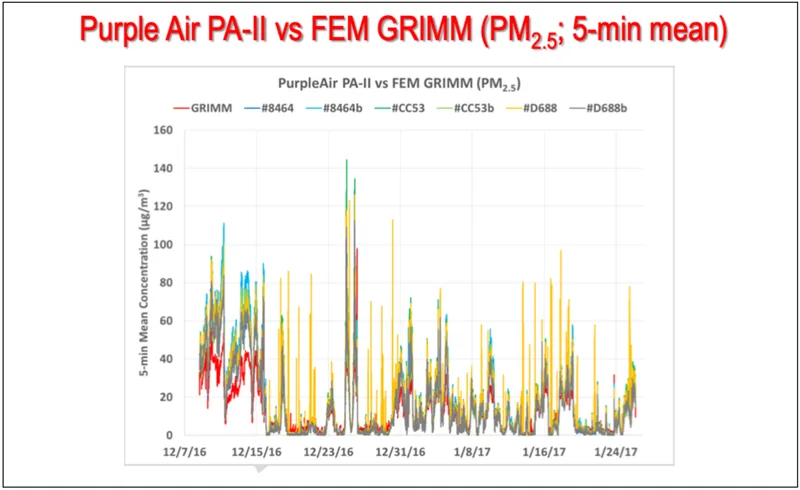
Let’s take an example. In AQ-SPEC laboratory testing, both the PurpleAir PA-II and the Aeroqual S500 achieve similarly high R² values, close to 0.99. That outcome is expected: in the lab, sensors are exposed to a wide, controlled PM2.5 concentration range, and R² is primarily used as a basic check that a sensor responds to changes in particle concentrations at all. Outdoors, however, the results diverge. While the PurpleAir maintains a high R² in field testing, the Aeroqual’s outdoor R² drops substantially. This difference is driven largely by the particle concentration ranges (0-140µg/m³ for the PurpleAir, and only 0-60µg/m³ for the Aeroqual) and dynamics each sensor happened to experience during its test period, rather than a change in sensor behaviour.
The way that the results are then summarised can unintentionally reinforce confusion. While AQ-SPEC does include additional metrics such as MAE, key contextual information (such as the concentration range or variability during a given test) is not visible on the main comparison table. That information exists in the detailed reports, but most readers will never dig that far. As a result, many comparisons are made between numbers that are not directly comparable. AQ-SPEC does include disclaimers noting these limitations, but they are easy to miss and rarely read. Just based on my experience alone, I regularly see users comparing R² values to compare low cost sensors and this often leads to incorrect or only partially accurate conclusions.
Why No Single Table Can Tell the Full Story
While R² comparisons are far from perfect, at the same time, we recognise how difficult this communication challenge is. Simply adding more columns to already dense tables would likely make them harder, not easier, to interpret. As such, we believe that the more realistic improvement lies in clearer framing: explicitly explaining what each metric captures, what it does not, and why certain comparisons should be treated with caution.
For this reason, we have consistently argued that AQ-SPEC results - valuable as they are - should not be treated as the final word on sensor quality, particularly for purchasing decisions. This perspective has shaped how we think about testing and interpretation more broadly. We too have now submitted our monitors for AQ-SPEC evaluation and look forward to seeing the results, but the points raised here apply regardless of how any single product performs.
Ultimately, highlighting limitations in testing methodology is not about undermining efforts like AQ-SPEC, which we genuinely believe provide important value. It is about helping readers interpret results more carefully. No single metric, table, or testing programme can capture the full complexity of air-quality sensor performance, and acknowledging that complexity is essential for making informed comparisons.
Our Final Thoughts
We participate in standardized sensor testing because transparent, independent evaluation is essential. At the same time, we remain cautious about how metrics like R² are used and discussed. Publishing numbers without explaining their limitations can create a false sense of certainty.
R² is appealing because it is simple. Accuracy is not. In air-quality monitoring, where data influence health decisions, public trust, and policy, that complexity should be acknowledged rather than hidden behind a single number.
With that being said, we are looking forward to seeing our own AQ-SPEC results and we hope that this piece isn’t taken as a criticism, but rather as a suggestion for improvement.