This article is part of a series, where we explore the hidden complexities of PM₂.₅ — tiny airborne particles that impact air quality and health. We will uncover the ambiguities behind its measurement, the challenges in assessing health risks, and the surprising insights that emerge. Each article will tackle a different aspect of PM2.5, shedding light on its hidden dilemmas and unanswered questions. Today’s article discusses the uncertainties behind the health effects of PM₂.₅ from a critical perspective.
Introduction
We all know the number: 4.2 million premature deaths in 2019 from outdoor air pollution, according to the World Health Organisation. What we also hear is that there is no safe level of PM₂.₅.
But how do we know this? And how much does the answer depend on where, when, and from what source that pollution came? Most of what we know about PM₂.₅ and health was built on evidence from a combustion-dominated world with coal fires, industrial smoke, and extreme pollution episodes. The question this article explores is how well that framework generalizes and whether conclusions drawn from high-pollution, combustion-dominated environments can be applied to places where those conditions aren't present. Another way to frame this question is: How confident are we that even very low concentrations cause relevant health damage?
Today’s article explores how scientists study the health effects of PM₂.₅. We look beyond the numbers and highlight methodological limitations that may surprise some readers.
PM and health historically
Let’s go back in time to London in December 1952. Over the course of just a few days, thousands of people died surprisingly. The increase in mortality was so sudden and unusual that people quickly noticed something was wrong. People began asking a simple but urgent question: Why are we dying?
At the same time, dense fog had settled over the city. It was so thick that daytime turned into near darkness, and visibility dropped to just a few metres (Figure 1).
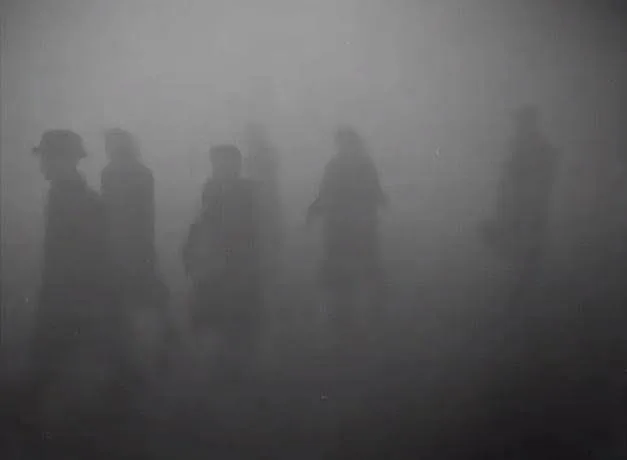
The coincidence of these two observations — extreme air pollution and increased mortality — quickly led to the suspicion that the fog might play a role.
The UK government established a committee to investigate air pollution. In 1953, the committee presented its findings to Parliament. Among them was a now-famous plot (Figure 2), showing concentrations of “smoke” and sulphur dioxide (SO₂) over time during December 1952, alongside the number of daily deaths.
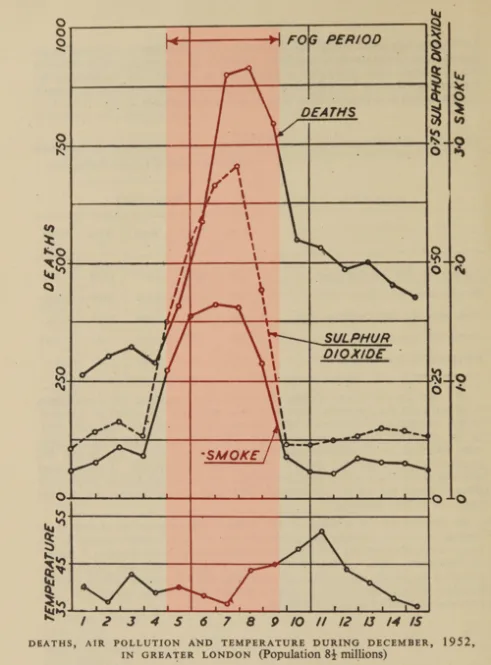
Figure 2 provides an early example of epidemiology, comparing population-level mortality with air pollution over time to look for potential links. The plot tells a clear story: when pollution rises, deaths rise too. On its own, this does not prove that air pollution caused the deaths. We also cannot tell from the data whether smoke, SO₂, a combination of both, or some coexisting factor was responsible.
This shows both the strength and the limits of epidemiology. It is excellent at spotting patterns and correlations that might otherwise go unnoticed, but proving causation is harder. Causation asks whether A causes B, B causes A, or whether some other factor connected to A is actually responsible for B.
The case of the London smog was unique. The effect was so extreme and instant that the link was widely accepted as causal. Parliament was convinced and concluded that the deadly fog was responsible for the excess deaths. This was remarkable: at the time, it was difficult for people to grasp that tiny particles drifting in the air could actually kill someone.
What makes these smog events particularly striking is the sheer magnitude of pollution. The reported “smoke” concentrations exceeded 1 mg/m³ (Figure 2), so high that they were recorded in milligrams and not micrograms. Converted into modern PM₂.₅ units, this corresponds to roughly 1000 µg/m³, a level nearly unimaginable today in many (though not all) cities worldwide. While these measurements are not directly comparable to the PM₂.₅ concept used today, they clearly indicate extremely high concentrations of airborne particles by any standard.
Why did such smog events occur?
In winter, stagnant air conditions in London can trap pollutants near the ground, allowing them to accumulate over several days. The committee identified coal burning, both from industry and households, as the dominant source, emitting large amounts of both tiny particles and sulphur dioxide.
Based on these findings, the UK introduced the Clean Air Act in 1956, encouraging a shift from coal to cleaner fuels such as coke and implementing emission controls.
In the decades that followed, increasingly strict air quality regulations led to a substantial reduction in emissions (Figure 3). Between 1970 and 2024, calculated annual emissions in the UK of PM₁₀, PM₂.₅, and SO₂ fell by 85 percent, 90 percent, and 99 percent, respectively. The actual reductions since 1952 are likely even larger, but I could not quantify them because official records typically begin in 1970. Note that the concepts of PM₂.₅ and PM₁₀ did not exist before the 1970’s and 1980’s.
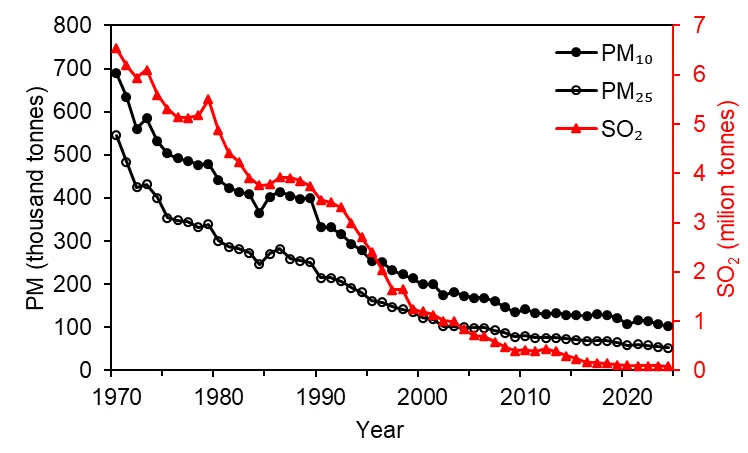
The long-term trend is clear: air pollution levels in the UK have declined dramatically since the mid-20th century. Whether today’s levels are comparable to those before the industrial revolution remains uncertain due to the lack of data from that time.
The London smog made one thing clearer: air pollution and health are linked. But understanding how they are linked, and how strong that link is, remains far more complicated.
Why are airborne particles from combustion sources so dangerous?
Now let’s take a look first at why particles from burning wood, coal, gas, oil or any other carbon source are so harmful to human health. I see three main factors that together form what I call the “triangle of death,” a simplified way to think about why these particles are so dangerous (Figure 4).
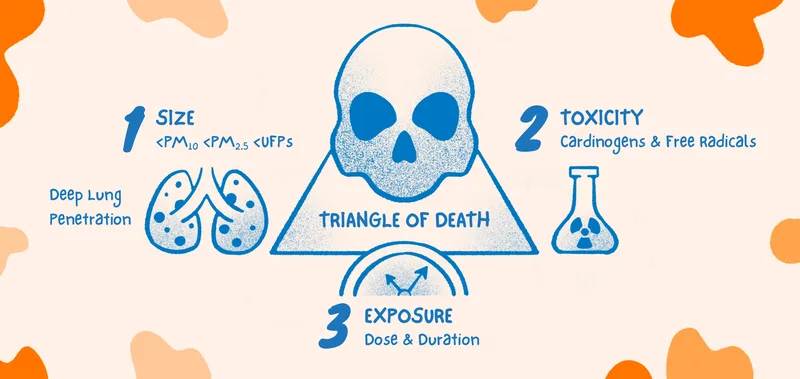
Death factor 1: Particle size
The size of a particle determines where in the respiratory system it is deposited:
- >100 microns
These particles rarely reach the lungs. They are usually trapped in the nose or throat by tiny hairs and mucus, a sticky fluid that protects the cells and traps particles. - < 10 microns
Particles of that size can reach the upper lungs (bronchi and bronchioles). Luckily, our lungs have defence mechanisms such as the mucociliary escalator: millions of microscopic “hairs” move mucus upward, carrying trapped particles to the throat to be expelled (for example, when we cough). Check out this video to see how this fascinating mechanism works. This system is remarkably effective, but it can be overwhelmed. Chronic exposure to particles here can cause inflammation, airway obstruction, excess mucus, and result in diseases such as asthma, chronic bronchitis, COPD, or even lung cancer if particles are carcinogenic. In the most severe cases, this chronic inflammation can block airways, lead to suffocation, and eventually death. - < 2.5 microns (fine particles)
Particles in this range can reach the deepest part of the lungs: the alveoli. These are tiny air sacs where the gas exchange occurs. The alveoli are delicate, with very thin walls to allow carbon dioxide from the blood to be replaced with oxygen from the air, which is the whole purpose of breathing. Unlike the upper airways, they do not have mucus and a mucociliary cleaning system, as this would impair the gas exchange. Particles deposited here are cleared only slowly by specialised cells. This makes the alveoli particularly vulnerable. Fine particles in this size range can cause inflammation, emphysema, fibrosis, and potentially lung cancer, contributing to serious disease and even death. - < 0.1 micron (ultrafines or nanoparticles)
These extremely small particles are a story of their own. They can penetrate deep into the lungs. However, there is a twist: at very small sizes, particles are increasingly lost through diffusion, depositing already in the nose and mouth. In other words, smaller does not always mean deeper. Because ultrafine particles can cross biological barriers more easily, many scientists explicitly or implicitly portray them as harmful. However, the evidence for their effects in humans is still inconclusive. Marie Bergmann and colleagues recently published a large review study, concluding that the overall evidence for long term health effects of airborne ultrafine particles remains inadequate to low. Nevertheless, the potential risks of ultrafine particles keep scientists on high alert, and research on their health effects is ongoing.
In short:
Particles between 0.01 and 1 micron hit the “sweet spot” for lung deposition. Big enough to avoid being lost through diffusion, but small enough to slip all the way into the most sensitive parts of the lungs. Now, guess the particle size of those from carbon combustion. Yes, they tend to fall exactly in this worst-possible size range. This is also shown in Figure 1a from our previous blog.
Death factor 2: Toxicity
Reaching the deep lungs alone does not make a particle harmful. For example, fine water droplets from steam in a shower can also reach deep into the lungs, but they do not cause damage. Similarly, airborne sea salt particles are generally much less harmful. They dissolve in the fluid of the lungs and typically trigger little to no response.
Particle size alone is not enough to cause damage. A second factor is needed: toxicity.
Combustion particles are solid and often poorly soluble, which means they can persist in the lungs and need to be actively cleared. This process itself can contribute to stress and inflammation.
On top of that, these particles are not just carbon. They carry a complex mixture of toxic chemicals, including reactive compounds that can generate oxidative stress, and toxic substances such as polycyclic aromatic hydrocarbons (PAHs). Some of these, like benzo[a]pyrene, are well known to be associated with lung cancer, particularly from tobacco smoke.
Death factor 3: Exposure
“The dose makes the poison.” These famous words are often credited to Swiss physician Paracelsus. The idea is simple: any substance can be a poison; it all depends on how much of it you are exposed to.
Take calciferol, for example. This substance is classified as harmful if swallowed, inhaled, or in contact with skin, and can damage organs with prolonged exposure. Warning labels even include a skull symbol. And yet, calciferol is simply another word for vitamin D, which is essential for human survival at low doses. At higher doses, it becomes toxic.
This illustrates an important distinction: toxicity or hazard is not the same as risk. A substance can have the potential to cause damage (hazard), but whether it does depends on the level of exposure (risk).
The same applies to airborne particles. Even if a particle is toxic and reaches the lungs, that alone does not necessarily cause damage. What matters is the dose, how much is inhaled, and for how long.
This is where all three factors come together to form the triangle of death for carbon combustion. Particle size allows the toxic substance to reach the parts of the lungs where it can do harm, and real damage occurs when exposure is high enough, either during short periods of extreme pollution, such as the London smog, or through long-term exposure to lower concentrations.
How do scientists know that PM causes health damage?
We’ve now looked at particulate matter from a historical perspective, especially in the context of combustion, and seen why these particles are so dangerous. But how do we know that PM actually harms health in the real world? And how can we quantify that risk?
To answer these questions, scientists rely on multiple approaches that together build a compelling picture. Two key methods are epidemiology, which studies patterns of disease in populations, and toxicology, which examines biological effects in laboratory experiments.
Method 1: Epidemiology
The London example provided convincing evidence that short-term exposure to extreme pollution can cause death. But what about long-term exposure to lower levels of air pollution?
This is where epidemiology comes into play again. The same principle that helped uncover the acute risks in London can also be applied to study chronic exposure. However, studying long-term effects is much trickier, especially at low concentrations. For example, epidemiologists may try to see if people exposed to more air pollution are more likely to develop lung diseases. While correlations can often be found even at levels around 10 µg/m³ of PM2.5, it becomes difficult to attribute the increased risk solely to air pollution. That is because air pollution often coincides with other factors like population density, lifestyle, diet, healthcare, wealth, age or even seemingly trivial things like noise from traffic. You can control for some of these factors statistically, but not for all. So, how do we know that the disease is caused by the pollution? In short, we do not know with 100% confidence.
Still, multiple lines of evidence can provide a compelling picture:
Acute effects: Extremely high pollution can cause immediate health damage, as in London, making causality easier to see. However, low levels like 10 µg/m³ usually do not produce obvious acute health effects.
Linearity: Most epidemiological studies show that the relationship between air pollution and health is roughly linear. This suggests that if high concentrations cause harm, low concentrations likely contribute as well. It would be an unusual coincidence if not.
Reproducibility across countries:
Similar correlations appear in many countries, which strengthens the case that the underlying cause is air pollution rather than lifestyle or other confounding factors that differ between countries.Smart study design:
One example comes from a study in China, which took advantage of a unique policy. People north of China's Huai River received coal-based winter heating, while those just south did not. This created a real-world experiment with millions of people. The populations were otherwise very similar, but life expectancy in the north was about three years shorter because of PM10 exposure, with more deaths from heart and lung diseases that correlated with air pollution. This example shows how clever study designs can go beyond simple correlations to provide strong evidence that long-term exposure to particulates causes health damage.
Method 2: Toxicology
Scientists do not just rely on one method to study how air pollution affects health. They piece together multiple lines of evidence. Toxicology is one of these pieces which helps to assess the biological plausibility of a correlation identified in epidemiological studies. In the lab, researchers expose models like lung cells or animals to particles and see what happens.
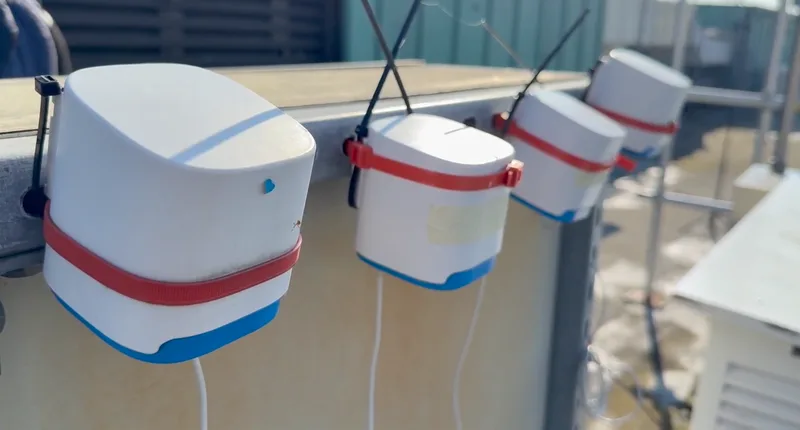
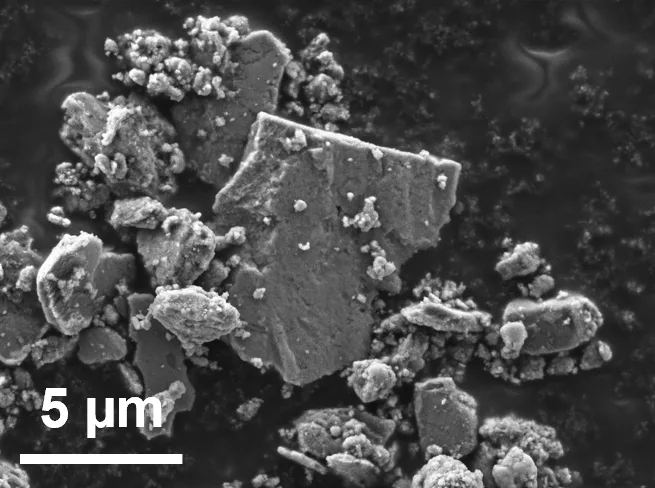
During my PhD, we exposed human lung cells to airborne particles generated from car brakes (Figure 5). The cells clearly reacted. They did not like it. But let’s be honest: we used much higher concentrations than people would ever breathe in, and only for a short time. We also used cancer cells, which are more robust than healthy lung cells, making it possible to carry out these experiments. Because of these limitations, we don’t really know what these results mean for people’s health. This might sound strange if you’re not a toxicologist, but it’s standard in this type of research. What we saw shows that these particles can cause damage (hazard), but it does not tell us whether they do cause damage (risk).
Even so, toxicology is useful. It shows whether a correlation found in epidemiology makes biological sense. And for combustion PM, many studies with lung cells and animals show that exposure can damage health and even cause cancer, reinforcing the understanding that these particles cause damage. But remember Paracelsus: “The dose makes the poison.” Just because something is harmful in the lab does not mean it is automatically harmful in the air we breathe, as many other factors influence how dangerous it actually is.
Controversial perspective
After going through the textbook knowledge regarding PM and health, it is now time to ask a controversial question that has just recently started slowly picking up momentum in the scientific community. Does the currently established link between PM₂.₅ and health still hold in low-pollution environments (e.g., ~10 µg/m³) that are not dominated by combustion PM? Remember the triangle of death: you need a lot of something very small and toxic to cause a lot of damage.
Evidence from low-exposure settings challenges current understanding
A recent study in low-pollution contexts questions the generalizability of earlier findings. This study, published in November 2025, found no association between long-term exposure to ambient air pollution and lung cancer incidence in Danish nurses between 1993/1999 and 2020. This result aligns with other studies conducted in low-exposure environments, suggesting that the dose-response relationship may be weaker or absent where PM levels are low and not combustion-dominated in the case of lung cancer.A lot of the knowledge comes from combustion
PM is a heterogeneous mixture of airborne particles. Some components, such as combustion PM or asbestos, are highly toxic, whereas others, such as sea salt, are relatively inert. Historically, studies treated PM as a uniform pollutant. This simplification was relatively accurate in high-combustion environments, but it becomes inaccurate in locations where non-combustion PM dominates. We still tend to treat all PM as the same, even though it is not.Temporal disconnect between exposure and observable effects
Correlations between PM and adverse health outcomes still exist today, even in cities where combustion PM has declined. However, caution is warranted: it is not always clear whether observed health effects result from current low PM or from historical exposure to high-combustion PM. This time lag complicates interpretation and may lead to overestimation of risk from today’s PM compositions.
Importantly, this view does not dispute the strong evidence that PM causes harm. Rather, it highlights open questions about how PM affects health at lower levels, particularly in situations where combustion is not the main source. In such situations, the type and toxicity of the particles themselves may be especially relevant.
Conclusion
Over the past 70 years, the air quality community has made remarkable progress. We moved from recognising airborne particles as a major public health threat to developing monitoring tools and implementing policies (largely targeting combustion) that have dramatically reduced exposure. Against this backdrop, it may be time to pause and reflect: where did we come from, where are we now, and how should we prioritise future efforts?
In the UK, this transformation is striking. London went from extreme pollution episodes with smoke levels exceeding 1000 µg/m³ and immediate health impacts, to a situation where combustion-related PM has dropped so dramatically that the sources of the remaining particles are now under scientific debate. British researchers are still discussing whether today’s PM comes mainly from primary sources, directly emitted by traffic, industry, and other activities, or secondary PM, which forms in the atmosphere through chemical reactions between gases. This is an important distinction, as both the potential health risks and the strategies needed to reduce exposure may differ depending on the source. At the same time, the WHO emphasises that no level of PM is completely safe, encouraging continued efforts to reduce exposure.
An important nuance emerges: the relationship between low-level, non-combustion PM and health appears less well understood than often believed. Much of our current framework is built on evidence from combustion-dominated environments, raising the question of how well these insights translate to today’s conditions.
With the “triangle of death” in mind, a set of novel questions arises: are the health effects of PM truly a function of particle mass only, or are they more source-specific than currently believed? Is it reasonable to push relatively low concentrations toward zero, given the increasing costs? Do the expected health benefits outweigh these costs? How do low-pollution environments affect susceptible individuals, such as those with asthma, COPD, or other pre-existing conditions? Finally, how should we define a meaningful endpoint, given that zero PM₂.₅ is not realistically achievable due to natural background sources such as Saharan dust or natural wildfires?
More broadly, this is a question of scientific focus and resource allocation. Should greater emphasis be placed on distinguishing between PM sources and compositions, for example, by further complementing PM₂.₅ mass measurements with combustion indicators such as black carbon? And is it proportionate that substantial resources are invested in further reductions in relatively low-pollution regions, while other parts of the world continue to experience concentrations exceeding 100 µg/m³?
Ultimately, acknowledging that PM can harm health was a crucial first step. While any efforts to push concentrations ever lower are welcome, a deeper understanding of where, when, and why that health risk arises allows us to address it more effectively. A more nuanced, source-aware, and globally informed perspective is needed to ensure that future air quality management remains proportionate to the risks it seeks to address.