With so many low cost sensor networks emerging all over the world, it can become difficult for scientists and researchers to determine which ones are most useful for their research. In practice, they would have to decide which ones fit best manually by looking at different platforms, maps, sensor databases, and comparing them across factors such as accuracy and accessibility. But recently, a system called the Low Cost Air Quality Sensor Harmonization Database has been developed to simplify this process.
How the database came to be
The Low Cost Air Quality Sensor Harmonization Database is a platform that compiles data from a wide network of sensors, and centralizes it into a common, open format for users to have easier access to it. To learn more about it and its use cases, I had the opportunity to interview Kristen Okorn, an air quality scientist at NASA’s Ames Research Center in California, who leads the team responsible for developing the database.
The concept of the database was realized through Kristen’s personal experience with sensors. Having used and deployed many herself, she noticed that much of the data collected often goes unused.
I myself as a sensor user, will spend all this time placing sensors, doing a lot of work on calibration. They may stay there for a few months, a few years, and that kind of feels like the end of it. A lot of times too, the sensors are in locations where the data could be useful to more folks than maybe just the scientific or community study that we’re doing – but there just isn’t a good pathway to have more end users and more access to that data.
Along with connecting more potential users with the data from these sensors, the database was also shaped by a request Kristen frequently encountered in her own work. Having deployed her own network in the past, she was often asked whether there were sensors available in specific locations that could be used for things like satellite validation. But as she pointed out, that was not always possible.
“In my work at NASA, a lot of folks will ask ‘I’m doing this satellite validation project, do you have a sensor in this area that could be useful for that?’ and the answer is usually no, because I’m one person and I only have so many sensors, but someone probably does.”
This realization became another driving force behind the database: not just making existing data easier to access, but making it easier to discover in the first place. By bringing together data from multiple networks, it creates a way for people to find relevant data beyond their own immediate reach.
But how exactly does data from various networks make it into one harmonized system?
The harmonization process
When the original sensor network contributes its data, the process looks different depending on the size and technical capacity of the network. Larger networks – like the AirGradient sensor network – have an API that allows the team to pull data directly, while smaller networks may simply send over a CSV file or even submit their data via email. Regardless of how the data is sent in, it is always on the harmonization database's team to reformat it into the system, which is something they are also working on automating to make the process less labor-intensive.
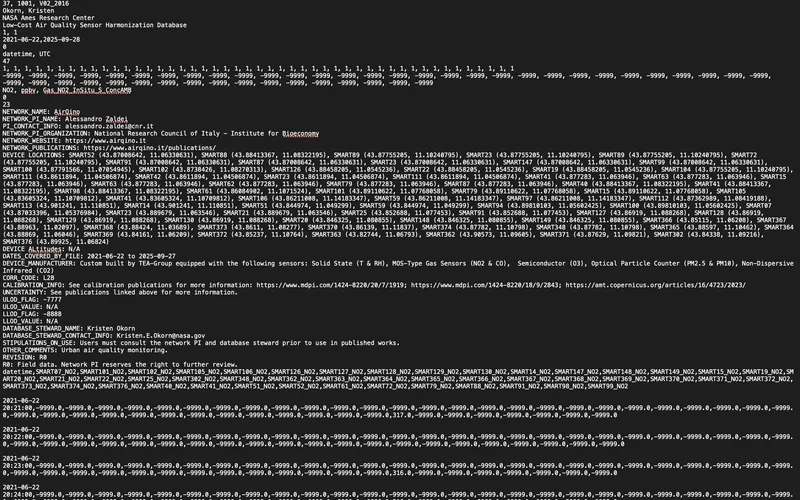
The data is then stored in the ICARTT file format – NASA's standard for atmospheric composition data – and can be downloaded directly through NASA Earthdata Search. While it is essentially a text file that can be opened in something as simple as Excel or Google Sheets, what makes it particularly useful is that the metadata is always embedded at the top. This means that whether you choose to use it or not, it is always there.
In relation to the metadata, what is perhaps most interesting about this part of the process is how collaborative it was to put together. The team consulted people across the sensor community at conferences and workshops to understand what would actually be useful when finalizing the metadata headings. As Kristen put it, “We tried to review a lot of efforts in having good metadata, so it was kind of a mix of other projects that were already out there and then talking to folks about what else would be useful to make it really specific to low cost sensors” – including drawing from a number of existing resources such as the Colorado Department of Public Health and Environment's Air Quality Data Exchange format, OpenAQ, US EPA data standards, and the Open Geospatial Consortium.
The result is a metadata section that works for everyone. For community users, it includes the sensor network's contact information and how to properly credit them. For scientific users, it covers calibration specifics, related papers, and relevant websites. Each dataset is also assigned a unique DOI upon upload, which is especially meaningful for smaller networks that may not have the infrastructure to do that on their own.
How the database differs from existing platforms
While there are several existing databases that already collate this type of data into one platform – such as OpenAQ – what sets this one apart is two things: its focus on gas-phase data, which can be harder to come by compared to PM data, and its calibration tier system that helps users quickly assess the quality of the sensor data.
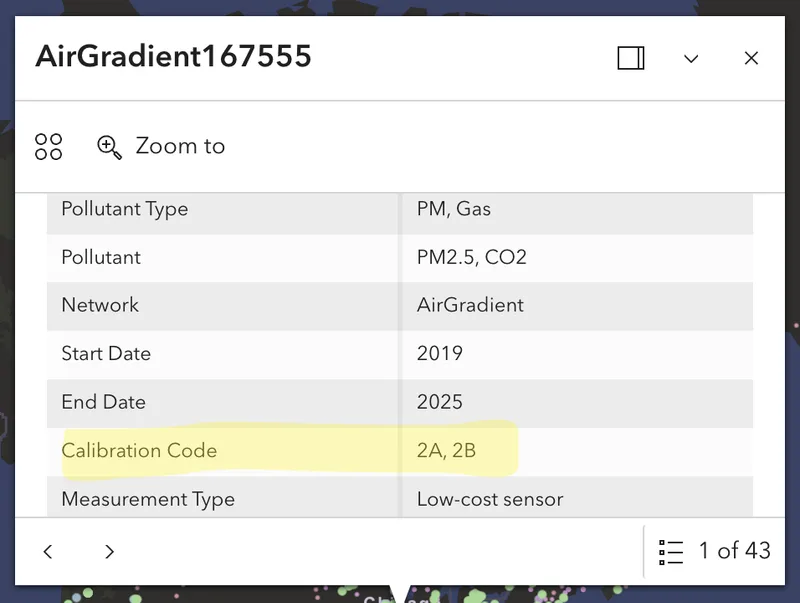
In the database, sensor data is labeled by its processing level using tiers based on an established rubric (Schneider et al.). Level 0 is completely raw. Level 2A data has been corrected using the sensor’s own onboard measurements, like internal temperature or interference corrections, while Level 2B data builds on that by also using relevant external inputs from nearby stations, such as temperature, humidity, or interfering gases. The database map currently includes data at Level 0, 2A, or 2B, helping users quickly see how much processing has been applied.
It’s important to note that the assigned tier is not a judgment call on the database's part, rather it reflects what the network owners report about their own calibration process through the same metadata form mentioned earlier.
The challenge of standardizing across networks
Of course, when it comes to harmonizing data from various sources, challenges are bound to come up along the way. Beyond the more logistical hurdles of working with networks that lack an API or the resources to submit data in a more efficient way, one of the bigger ongoing challenges is the standardization itself.
The sensor community is growing rapidly, and with that comes a lot of different groups independently working toward their own versions of a standard. As Kristen explains, there is no governing body dictating what that standard should look like, which makes alignment across agencies and organizations difficult. The harmonization database's approach is built on community feedback and existing efforts, but that does not mean everyone will adopt it.
I think that’s just the challenge with trying to standardize in general – there’s no real authority on what the standards are. We can only control our own data, and there isn't really a standard beyond that. We're trying to just talk to as many other people as possible to get on the same page about whether we need to add things or subtract things.
It is something the team is actively working through by keeping communication open with colleagues across agencies and remaining willing to revisit and refine what they have built as they learn more.
Where the database is headed
As of now, all of the data available on the platform is historical, with the oldest networks dating back to around 2012. One of the next steps for the database is the addition of real-time data infrastructure.
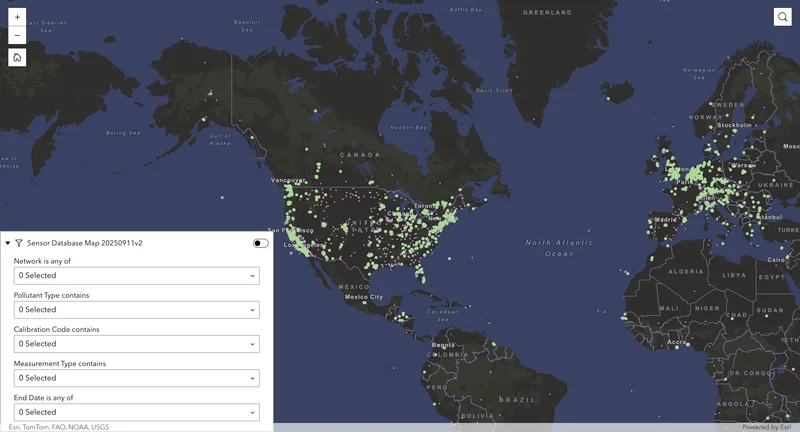
Beyond that, expanding global coverage is also a priority. The database is currently skewed toward the North America region, which is something Kristen is actively trying to change through outreach.
Both of these developments point back to the same underlying goal that shaped the database from the start: making sensor data easier to access and more useful across different contexts. Whether it is being used to support scientific validation, or simply to give visibility to smaller networks, the value of the database depends on how well it can continue to bring different types of data into one system without losing the context behind them.
The Low Cost Air Quality Sensor Harmonization Database is still a growing project, but it already addresses a gap that many in the sensor community have experienced firsthand. It does not remove the challenges of standardization or data quality, but it creates a structure where those differences are at least visible and easier to work with.
For those who are interested in contributing their own network's data, the process is designed to be as accessible as possible regardless of a network's size or technical capacity. In case you are interested, you can reach out to the harmonization database team to learn more about how to get involved!
References
Schneider, Philipp et al. “Toward a Unified Terminology of Processing Levels for Low-Cost Air-Quality Sensors.” Environmental science & technology vol. 53,15 (2019): 8485-8487. doi:10.1021/acs.est.9b03950