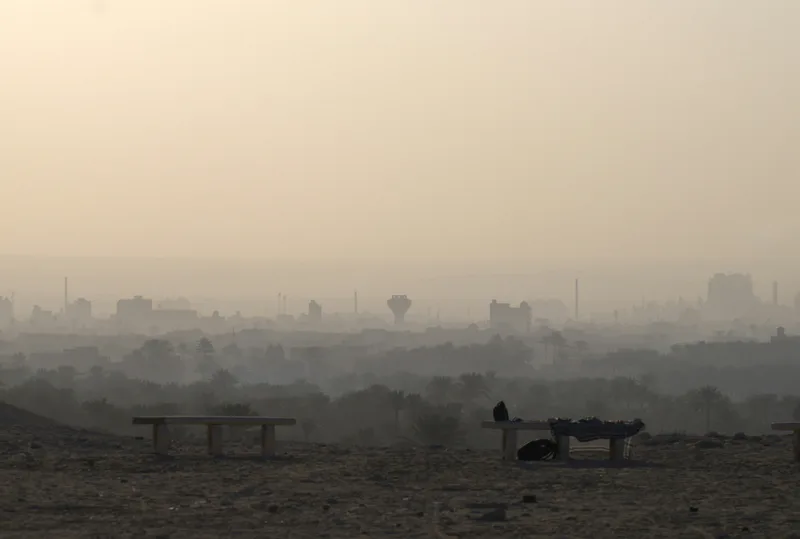
A few months ago, I came across a social media post from a neighbouring city showing that low-cost air quality sensors had been deployed across the area. My initial reaction was positive, as the network seemed to cover a large portion of the city.
As I explored further, though, I began to notice a disconnect between the presence of the network and the way its data was shared. The information was presented through a static image showing a 24-hour average for PM2.5 across the city. While this offered a general snapshot, it did not tell me how air quality changed throughout the day, or whether there were specific moments when pollution levels spiked.
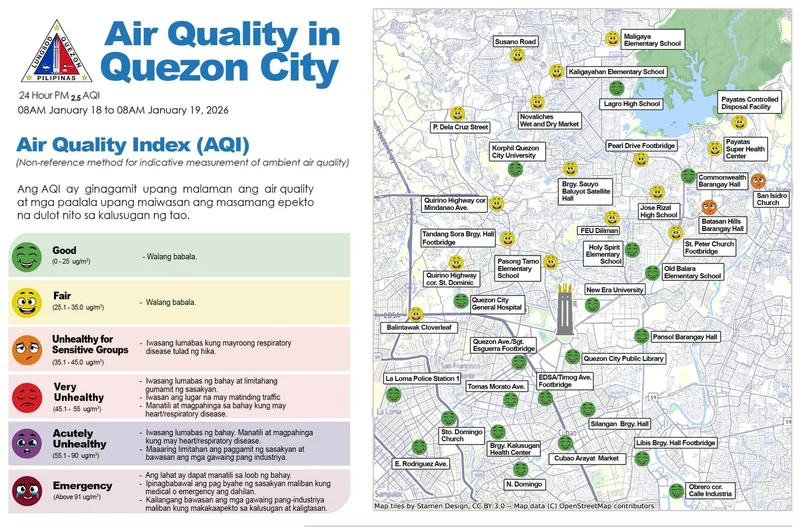
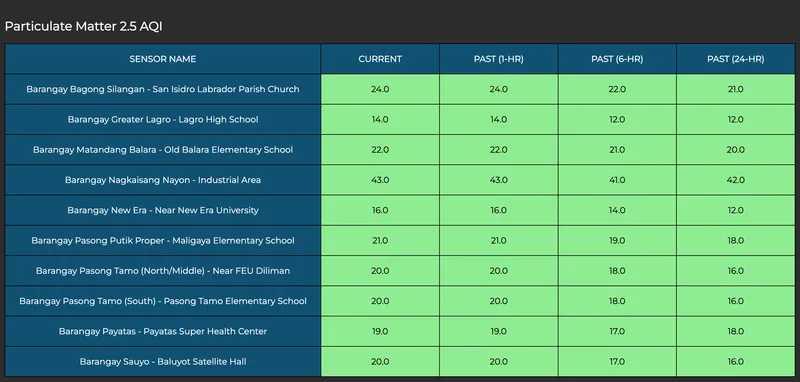
When I followed up through the same public channel to ask whether real-time data was available, I was directed to a table hosted on the network’s website. The data was there, but the format was not particularly user-friendly or easy to interpret.
This is where my concern begins. Having access to air quality data is a good start, and so is establishing a monitoring network – but the way data is presented is just as important as the data itself. When information is difficult to interpret or only accessible in limited formats, it creates barriers that prevent people from actually using it.
That experience left me with a bigger question: was this a limitation of one city’s platform, or part of a broader pattern in how air quality data is shared?
What “open” really means
Looking into this question led me beyond my own experience and into a growing body of research on how air quality data is shared. I came across a report led by OpenAQ titled “Open Air Quality Data: The Global Landscape,” which assesses whether and how national governments are producing and sharing air quality data with the public. Even though the report focuses on national-level data, I was struck by how closely it reflected what I had already encountered at the city level. The issues it describes felt familiar.
As the report notes, “Although sharing data as a PDF or graphic is a good first step, when data is provided in a machine-readable, analysis-ready and standardized form, many more use cases—and ultimately, impact—can be derived from the data.”
That line felt like a clear validation of my initial frustration. My concern had never been that air quality data did not exist, but that it was often locked into static formats that limited what anyone could actually do with it.
What surprised me, though, was realizing that this was only one part of a much bigger picture. As I read further, it became clear that accessibility isn’t defined by a single feature such as real-time updates or interactive maps. It depends on a broader set of conditions, and missing even one of them can sharply reduce how useful the data really is.
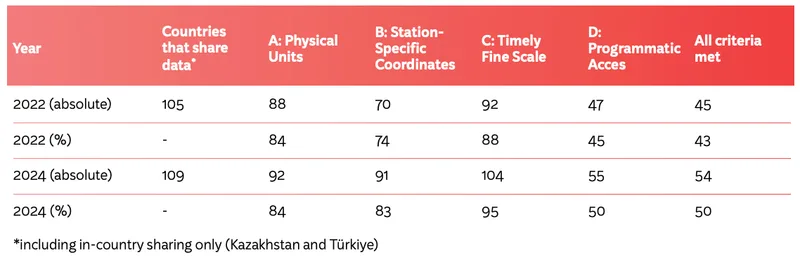
The report outlines four concrete criteria for air quality data to be considered fully open and accessible:
- It should be shared in physical units, not just simplified indices
- Linked to specific monitoring locations
- Released in a timely and continuous way
- And made available in formats that allow for reuse
Only after seeing those criteria laid out did the scale of the issue really sink in.
According to this global assessment, only 54 countries currently share air quality data in a way that fulfills all four criteria. In most places, data may be collected and even published, but it falls short in key ways.
That statistic made it clear that what I encountered wasn’t unusual, but actually part of a much wider pattern: monitoring networks are expanding, but the way data reaches the public often hasn’t kept pace.
Why usable data changes what people can do
This is where achieving those criteria starts to matter in practice. Air quality data only becomes meaningful when it reflects how pollution actually behaves. Exposure isn’t shaped by concentration alone, but by timing as well. A daily average tells us very little about what happened during the morning commute, the midday heat, or the evening rush. It doesn’t show when conditions worsened, how long they stayed that way, or whether those patterns repeat.
When data is difficult to interpret or shared in formats that limit reuse, it restricts action. People can’t easily adjust their routines, decide when to spend time outdoors, or understand which neighbourhoods are most affected. For communities trying to advocate for cleaner air, unclear or delayed data makes it harder to point to concrete patterns or moments of concern.
Christa Hasenkopf, EPIC’s Clean Air Program Director, captures this clearly in her article “Poor air quality is shortening our lives – asking for open data can change that.” She writes that “when air quality data is available to communities, the issue gains momentum, the public and governments are spurred to take action and the air ultimately gets cleaner.” That momentum depends not just on data being visible, but on it being usable.
When monitoring is only the beginning
Looking back at that initial moment of curiosity, what stays with me isn’t disappointment, but a clearer sense of what was missing. Finding a monitoring network near my city was genuinely encouraging, and it still is. At the same time, it highlighted that measuring the air and sharing it with the public is only a first step, and that the responsibility doesn’t end there.
The real impact comes from what happens next: whether the data is timely, interpretable, and accessible in ways that people can efficiently engage with. Without that, even well-intentioned monitoring efforts risk falling short of their potential.
The good news is that the tools and standards to support better data sharing already exist. What’s needed now is a stronger commitment from both national and local governments to close the gap between data collection and public access.
Because air quality data only becomes meaningful when it moves beyond static images and into the hands of communities it’s meant to serve.
Sources
Hasenkopf, C. (2024). Poor air quality is shortening our lives — asking for open data can change that. World Economic Forum. https://www.weforum.org/stories/2024/09/poor-air-quality-taking-years-off-lives-open-data/
Rosales, C. M. F., Hagerbaumer, C., Sawant, V., Marte, J., & Biggs, R. (2024). Open air quality data: The global landscape. OpenAQ. https://documents.openaq.org/reports/Open+Air+Quality+Data-The+Global+Landscape+2024.pdf