Low-cost sensors (LCS) are transforming how we monitor air quality, making air pollution measurement far more accessible than ever before. These tools can provide a deeper understanding of air pollution at every level from individual scales to global scales. However, their potential is truly unlocked when they are used in large-scale networks alongside data from reference monitors, satellites, and scientific models.
Unfortunately, the regions with the worst air pollution are often those most lacking the infrastructure to monitor it effectively. This is where Low-Cost Sensors can help. While Low-Cost Sensors (LCS) have made monitoring vastly more affordable, ensuring their data is actually accurate is a massive challenge. Typically, this requires expensive reference equipment. To solve the accuracy problem, we use what’s called a Hybrid Network, a strategic combination of affordable local sensors and highly accurate, reference instrument equipment.
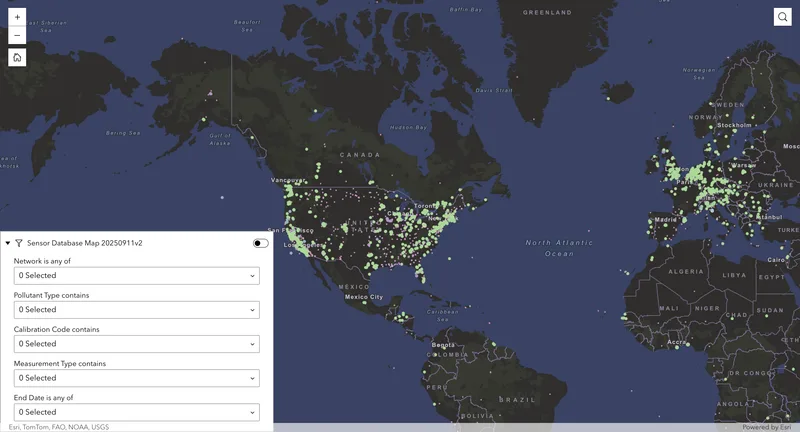
What is a Hybrid Network?
A Hybrid Network connects two extremes together. On the one hand, you have government-grade reference monitors, which are highly accurate but expensive (often costing more than 30,000 USD). On the other hand, low-cost sensors can provide great coverage across a city due to their lower costs (around $200-$300), but their accuracy might be lower or they may become unreliable over time. By combining the two sensor types, we get the best of both platforms: the accuracy of reference stations and the widespread, hyperlocal coverage that LCS allow.
Why Choose a Hybrid Approach?
There are a few significant advantages to the hybrid approach:
- Cover more area: You can monitor an entire area (whether it be a community, city or region) for the same price as one reference station.
- Data you can trust: By linking small sensors to a reference monitor, you can be sure your readings are actually accurate.
- Spot the real problems: It helps you tackle specific local pollution from nearby local sources that reference stations far away would miss.
- Automated maintenance: Software takes care of all the technical adjustments automatically, decreasing the need for manual maintenance.
While the idea of a hybrid network is straightforward, the real challenge is turning it into a system that continuously produces reliable data. To do this, we built an automated workflow inside the AirGradient Dashboard.
How the Hybrid Calibration Process Works
We’ve turned complex atmospheric science into a simple, automated process within the AirGradient Dashboard, allowing you to ensure your data remains accurate. Here is a step-by-step list of the actions we take to ensure this.
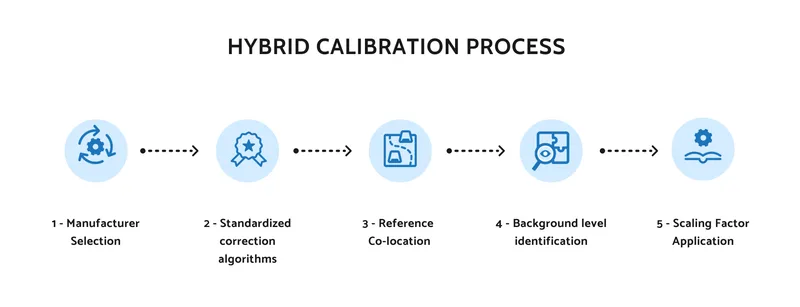
1. Manufacturer Selection
Firstly, we use modules from world-class manufacturers (for example, Plantower or Sensirion). These popular and well-studied sensors are intended to provide accurate raw data from the start. Choosing a monitor with a trusted sensor module is the first step toward reliable results.
2. Standardized correction algorithms
Standardized Algorithms use well-tested correction factors. For example, the US EPA Correction algorithms for Plantower (PMS5003) sensors have been shown to accurately align raw sensor data with real-world conditions.
3. Reference Co-location
AirGradient tests all assembled monitors in our test room chamber against an EU-approved reference instrument, the Palas Fidas® 200. This factory-level testing guarantees both precision and accuracy from day one.
4. Background level identification
Once sensors are deployed, our software looks at the whole network to find the "regional background", the baseline air quality shared by the entire area. We filter out local spikes of pollution to see the true underlying air quality.
5. Scaling Factor Application
We then compare your network’s baseline to the nearest reference station. The system calculates a "Scaling Factor" to bridge any gaps, automatically adjusting your sensors to match the accuracy of reference equipment.
Network Calibration in the Real-World (Community Impact in Pai)
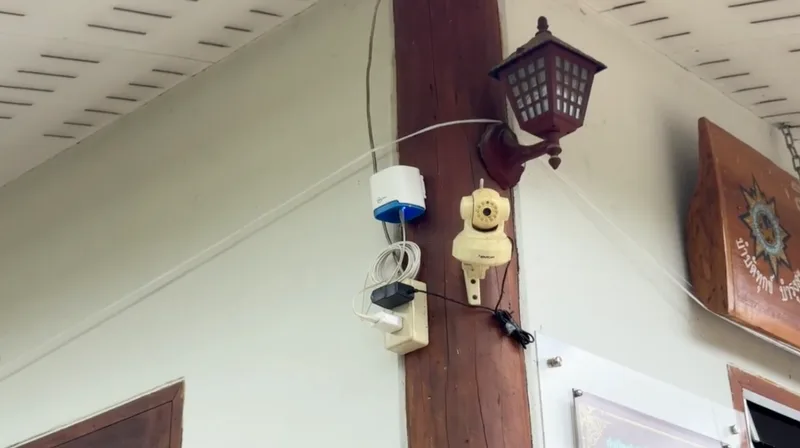
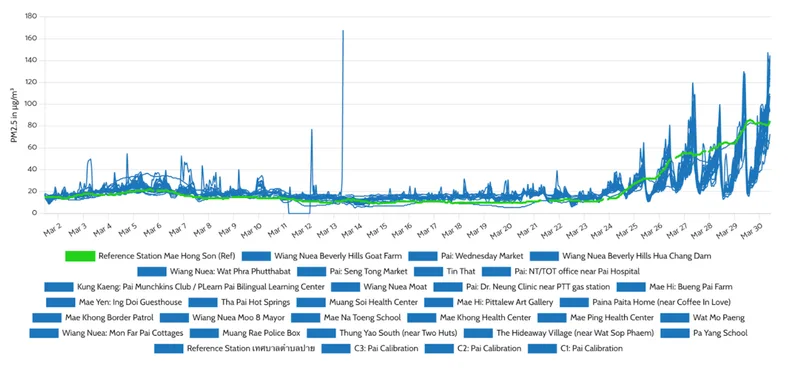
AirGradient monitors were deployed in a wide range of strategic locations in Pai, Mae Hong Son, including a hospital, border patrol station, mayor's residence, and even the immigration office, with the goal of using air quality monitoring and community action to better understand pollution and support for local solutions.
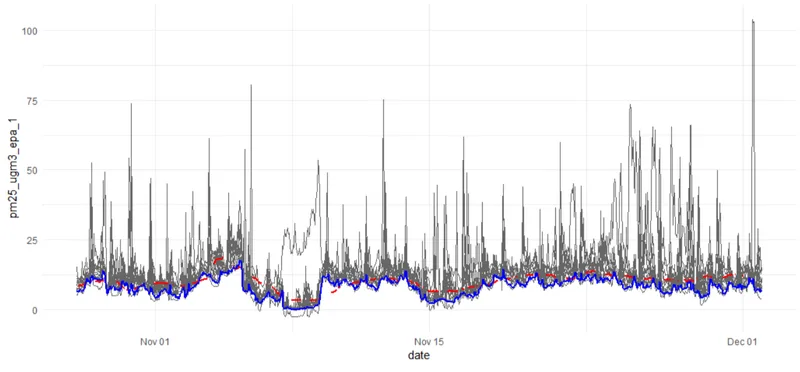
To calibrate the low cost monitors, we can use the sensor network data to extract that underlying regional background. We do this by mathematically removing the short-term local exposures.
In the case above, the calibrated measurements from the sensor network are shown in grey, calibrated baseline (10th percentile) is shown in blue, and the reference measurements (50 km away) are represented by the red line. As you can see, the calibrated data is much closer to the reference data, even though the reference is located a significant distance away.
Why This Matters
The goal of hybrid network calibration is not just to improve numbers, but also to improve data accuracy. By reducing technical uncertainty, we give communities the reliable instruments they need to demonstrate an issue and support for actual policy changes. Every local monitor contributes significantly to a global mission, helping us in moving toward a future where everyone has access to clean air.