Your Students Are Breathing Harmful Air Right Now
Research shows that classroom air quality frequently exceeds safe levels, with this invisible crisis affecting millions of students daily, contributing to:
Increased Respiratory Issues
1 in 13 students has asthma (CDC, 2023), and poor indoor air quality is a documented trigger
Higher Infection Rates
Studies show inadequate ventilation significantly increases airborne disease transmission
Chronic Health Symptoms
Poor ventilation is linked to increased headaches, fatigue, and difficulty concentrating
Reduced Attendance
Schools with air quality issues report higher absenteeism rates
Learning Difficulties
Harvard research shows cognitive function declines when CO2 exceeds 1,000 ppm
The Cost of Inaction Is Too High
The CDC reports that students with asthma miss more school days than those without, with indoor air quality being a significant factor. For a typical school, this represents thousands of lost learning days annually.
But there's hope. Schools that implement comprehensive air quality monitoring and improvements report significant reductions in illness-related absences and improved academic outcomes. The solution starts with understanding what's in your air.
The Health Impact Is Immediate and Measurable
Extensive peer-reviewed research reveals how poor air quality directly harms student health and performance:
Respiratory Health
Studies show that improving classroom ventilation can reduce respiratory infections and asthma-related incidents significantly. The EPA estimates that poor indoor air quality contributes to millions of lost school days annually.
Cognitive Function
Harvard researchers (Allen et al., 2016) demonstrated that cognitive function scores doubled when CO2 levels decreased from 1,400 ppm to 550 ppm. In classrooms where CO2 routinely exceeds 2,000 ppm, students show measurable declines in decision-making ability and test performance.
Disease Transmission
Research published in Environment International (2020) shows that proper ventilation dramatically reduces airborne virus transmission. Wells-Riley modeling suggests keeping CO2 below 800 ppm as a proxy for adequate ventilation can reduce infection risk by up to 5-fold.
Academic Performance
A study of California schools (Haverinen-Shaughnessy et al., 2015) found that improving ventilation rates from 5 to 20 cfm per student correlated with 2-3% gains in math and reading scores. Similarly, research shows that reducing PM2.5 exposure improves cognitive performance and test scores.
Teacher Wellbeing
Studies indicate that teachers in properly ventilated classrooms report fewer health symptoms, including headaches and voice problems, leading to reduced sick days and improved job satisfaction.
Documented Improvements from Real Schools
Research and case studies demonstrate the measurable impact of air quality monitoring and improvements:
Reduced Illness
Schools implementing comprehensive IAQ programs report 10-20% reductions in absenteeism. Studies show that improving ventilation to meet ASHRAE standards can reduce illness transmission by 35-50%.
Asthma Management
EPA case studies document schools that reduced asthma incidents by 20-60% through IAQ improvements, including better ventilation and removing triggers.
Academic Gains
Multiple studies correlate ventilation improvements with test score increases of 3-8%. Schools meeting recommended ventilation rates show consistently higher academic achievement.
Energy Savings
Demand-controlled ventilation based on CO2 monitoring typically reduces HVAC energy use by 10-20% while maintaining healthy air quality.
Making Air Quality Monitoring Work in Your School
Assess Your Current Situation
Start by identifying priority areas: classrooms with poor ventilation, spaces with high occupancy, areas near pollution sources (roads, labs, cafeterias). Our team can help you determine optimal monitor placement for comprehensive coverage.
Deploy and Start Monitoring
Installation takes minutes - simply plug in and connect to WiFi. Monitors begin collecting data immediately, with results visible on your dashboard within seconds. No technical expertise required.
Understand Your Data
Our intuitive dashboard shows clear, actionable insights. Green means healthy, yellow suggests attention needed, red requires immediate action. Automated alerts notify you when levels exceed safe thresholds.
Take Action
Quick wins: Open windows when CO2 is high, adjust HVAC schedules, relocate activities from problem areas
Medium-term: Change cleaning product schedules, improve filter maintenance, add air purifiers
Long-term: Use data to justify ventilation upgrades, secure funding for improvements, achieve building certifications
Engage Your Community
Share data with parents, students, and staff. Transparency builds trust and support for improvements. Many schools use displays in hallways to show real-time air quality, empowering everyone to be part of the solution.
One Solution, Triple Benefits
With AirGradient, you're not choosing between health, education, and compliance - you're achieving all three with one comprehensive solution.
1. Protect Student Health
Immediate impact: Reduce asthma triggers, prevent headaches, decrease disease transmission
Long-term benefits: Better attendance, improved wellbeing, healthier school community
Peace of mind: Know you're providing the safest possible environment for learning
2. Enhance Learning Opportunities
STEM integration: Real-world data for science projects and environmental studies
Student engagement: Hands-on assembly options for ages 11-18
Critical thinking: Analyze data, propose solutions, see real impact
3. Achieve Building Standards
Certification ready: Meet WELL, RESET, LEED, and FITWEL requirements
Grant eligibility: Qualify for green building and health improvement funding
Energy savings: Optimize ventilation based on actual occupancy and air quality
Start Today - See Results Within Weeks
Deploy and Discover
Install monitors in priority areas. Immediately see CO2, PM2.5, and TVOC levels. Identify problem areas and quick-win opportunities.
Quick Wins
Implement no-cost improvements: adjust ventilation schedules, open windows strategically, relocate sensitive activities. Studies show these simple changes can improve air quality metrics by 20-30%.
Build Support
Share data with stakeholders. Use evidence to secure buy-in for larger improvements. Apply for grants using documented air quality issues.
Systematic Improvements
Implement medium-term solutions: upgrade filters (MERV 13+), adjust cleaning protocols, add targeted air purification. Track improvements and celebrate successes.
Justifying the Investment
Health Cost Savings
The EPA estimates reducing absenteeism by 10% saves schools $30-60 per student annually
Energy Optimization
Research shows demand-controlled ventilation typically saves 10-20% on HVAC costs
Grant Opportunities
Federal and state programs increasingly prioritize schools with documented IAQ improvement plans
Risk Mitigation
Proactive monitoring helps meet ASHRAE 62.1 standards and demonstrates duty of care
We're Here to Help
Our education team provides free consultation to help you get started. We'll help with monitor placement, data interpretation, and creating your improvement plan. Join thousands of schools worldwide prioritizing student health through better air quality.
Contact our education team for volume pricing and implementation support.
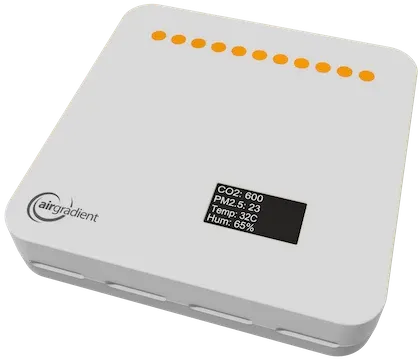
Understanding What We Monitor and Why It Matters for Student Health
Each parameter we measure directly impacts student health and wellbeing. Here's what our professional-grade sensors track and why it's critical for your school.
CO2 - The Ventilation Indicator
Health Impact: High CO2 causes drowsiness, headaches, and difficulty concentrating. Levels above 1,000 ppm reduce cognitive performance by 15%.
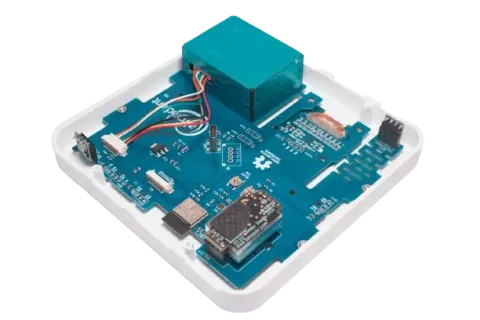
What We Measure: SenseAir S8 NDIR sensor with ±40ppm accuracy tracks levels from 400-10,000 ppm.
Action Threshold: Open windows or increase ventilation when levels exceed 800 ppm.
PM2.5 - The Invisible Threat
Health Impact: Triggers asthma attacks, causes respiratory irritation, and increases infection risk. Long-term exposure linked to reduced lung development in children.
What We Measure: Plantower laser sensor detects particles from outdoor pollution, HVAC issues, and indoor sources.
Action Threshold: Investigate sources when PM2.5 exceeds 12 μg/m³.
TVOCs - Chemical Pollutants
Health Impact: Causes headaches, eye irritation, and allergic reactions. Linked to 'sick building syndrome' and reduced attention span.
What We Measure: Sensirion SGP sensor detects emissions from cleaning products, paints, and furnishings.
Action Threshold: Review cleaning schedules and product choices when TVOC index exceeds 250.
Temperature & Humidity - Comfort and Health
Health Impact: Poor thermal comfort reduces learning ability. High humidity promotes mold and dust mites, triggering allergies and asthma.
What We Measure: Precision sensors (±0.2°C, ±2% RH) ensure optimal conditions.
Action Threshold: Maintain 68-74°F and 30-50% humidity for optimal health and learning.
Creating Tomorrow's Environmental Leaders
Empower students with the tools and knowledge to understand and improve their environment
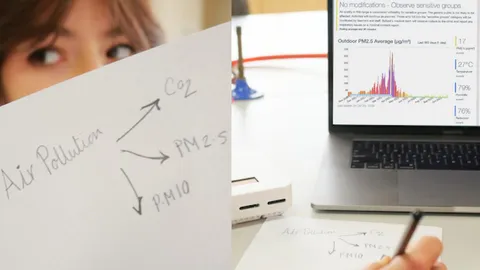
Real-World Research Projects
Students investigate questions that matter: Does opening windows during high pollen days help or hurt? How do CO2 levels change during exams? What's the air quality impact of the chemistry lab? These investigations develop critical thinking while addressing practical school challenges.
Cross-Curricular Learning
Air quality monitoring spans multiple disciplines. Use sensor data in statistics classes, explore chemical reactions in science, calculate ventilation rates in physics, and discuss environmental justice in social studies. One tool, endless learning opportunities.
Student-Driven Discovery
When students assemble their own monitors, they take ownership of the data. They propose hypotheses, design experiments, and present findings to administrators. This agency transforms passive learners into active environmental advocates and future scientists.
Community Impact
School air quality projects often expand beyond campus. Students present to school boards, securing funding for ventilation improvements. They share data with parents, raising awareness about indoor air quality at home. Some even influence municipal air quality policies.
Proven at Scale: 2,000 Monitors in UK Schools
AirGradient was selected for the world's largest school air quality study - the SAMHE Project. Our monitors are gathering data from 2,000 UK classrooms, building an unprecedented dataset that will shape national policies on school ventilation and health. This massive deployment demonstrates the reliability, accuracy, and scalability of our monitoring solutions. Schools participating in SAMHE report improved awareness of air quality issues and concrete actions taken to improve ventilation based on monitor data.
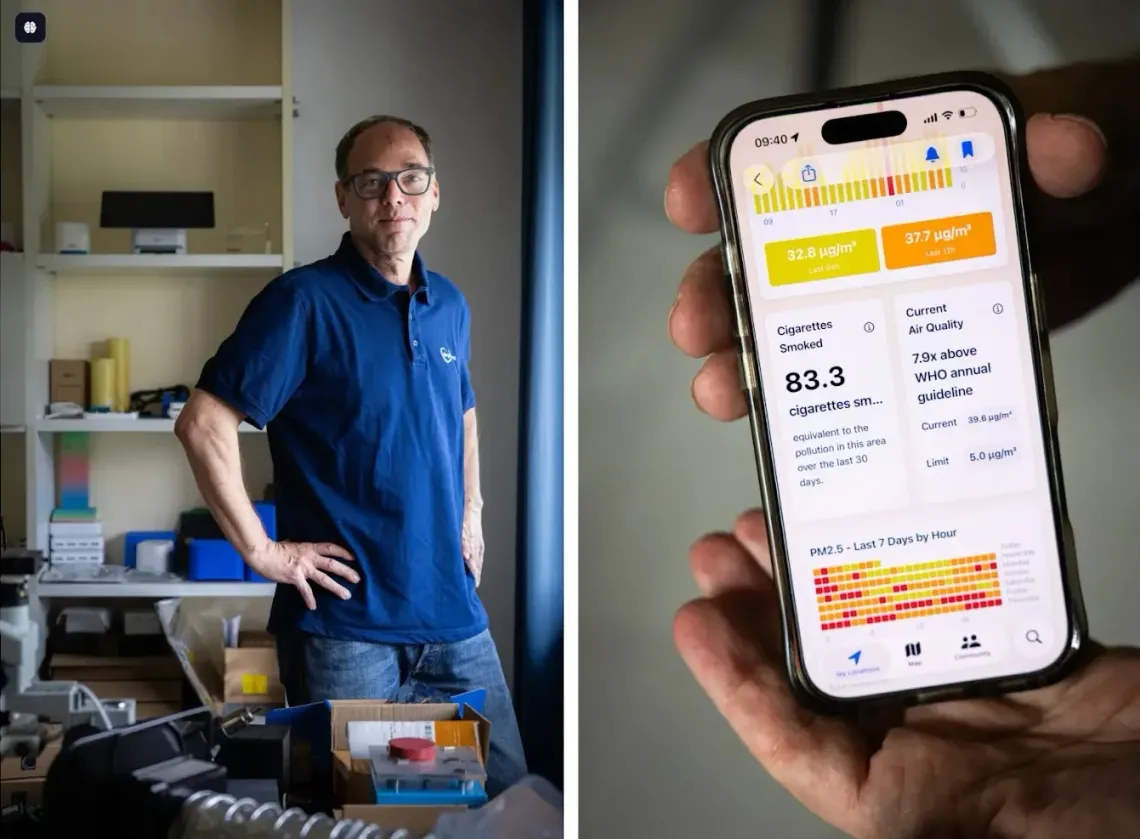
The New York Times: Democratizing Air Quality Monitoring
The New York Times featured AirGradient's mission to make air quality monitoring accessible worldwide through affordable, open-source sensors. The article tells the story of how AirGradient grew from a father's concern for his family in smoke-filled Chiang Mai to a global movement - with nearly 50,000 monitors deployed across 85+ countries, empowering schools, communities, and citizens to understand and act on their local air quality data.Read More. about The New York Times: Democratizing Air Quality Monitoring
Choose Your Implementation Path
Select the approach that best fits your school's needs and timeline. All options provide the same professional-grade monitoring capabilities.
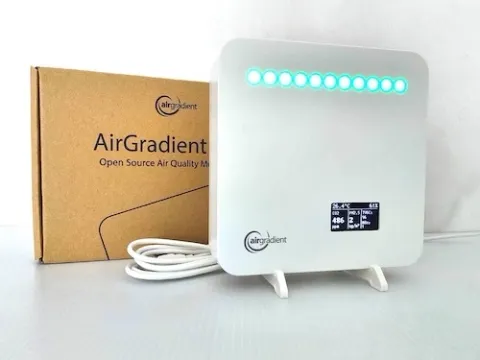
Quick Deployment
(Fully Assembled - USD 230)
For schools needing immediate action on air quality concerns. Pre-calibrated monitors arrive ready to plug in and start protecting student health within minutes.
- Immediate deployment for urgent health concerns
- Professional-grade sensors pre-calibrated
- Real-time dashboard and alerts
- 12 months dashboard access included
- Suitable for grants and certification requirements
- Full technical support and implementation guidance
- 12 months warranty
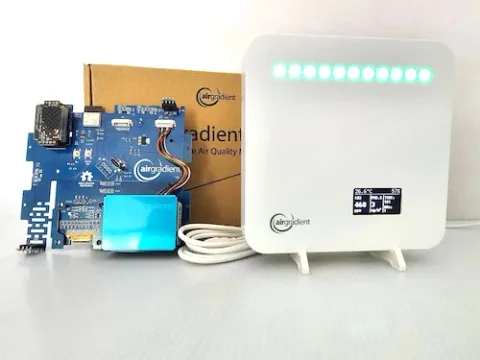
Educational Integration
(DIY Kit - USD 138)
Combine health monitoring with STEM education. Students build monitors themselves, creating investment in air quality while learning valuable skills.
- Hands-on learning opportunity (ages 11-18)
- Same professional sensors as assembled version
- No soldering required - safe for students
- Curriculum integration resources included
- Builds student ownership of air quality
- Volume discounts for classroom sets
- Teacher training and support available
Contact Our Education Team for Implementation Support