When discussing air quality monitors, most conversations focus on sensor types and accuracy claims. Much less attention is given to how raw sensor signals are processed, calibrated, and transformed into the numbers users ultimately see on their dashboards. Yet this processing layer is critical. Small decisions in calibration, and even filtering can significantly influence reported values. We want to be transparent about the data output by our monitors, so we decided to make a post detailing everything you need to know to understand and trust the data from your AirGradient monitor.
Our Data-Processing Approach
All AirGradient monitors provide both raw sensor outputs and calibrated data values (for applicable parameters). Calibration algorithms and methodologies are publicly documented on our website, and firmware source code is fully open-source and available on GitHub for independent review and analysis.
Our processing approach is transparent by design. Where applicable, pollutant-specific calibration functions are applied based on publicly documented methods, and users can access, audit, and replicate all data processing steps. Details of our validation and calibration procedures are also publicly available.
Particulate Matter (PM₁, PM₂.₅, PM₁₀)
For particulate matter, AirGradient devices using the Plantower PMS5003 / PMS5003T sensors provide:
- Raw PM₁, PM₂.₅, and PM₁₀ values
- Factory-calibrated PM₂.₅ values
- EPA-corrected PM₂.₅ values
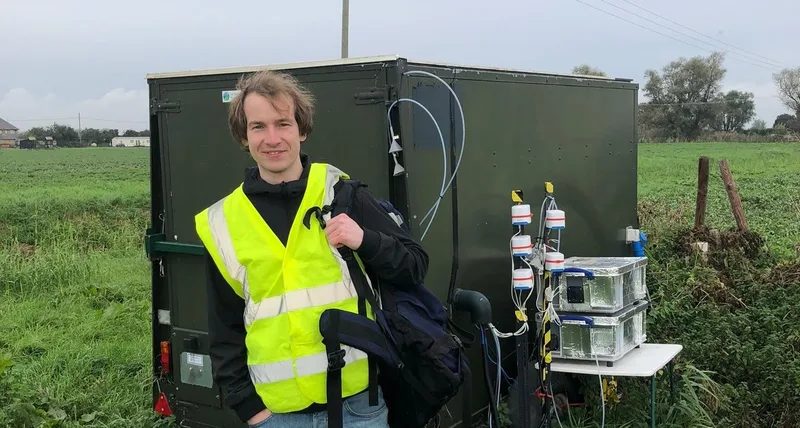
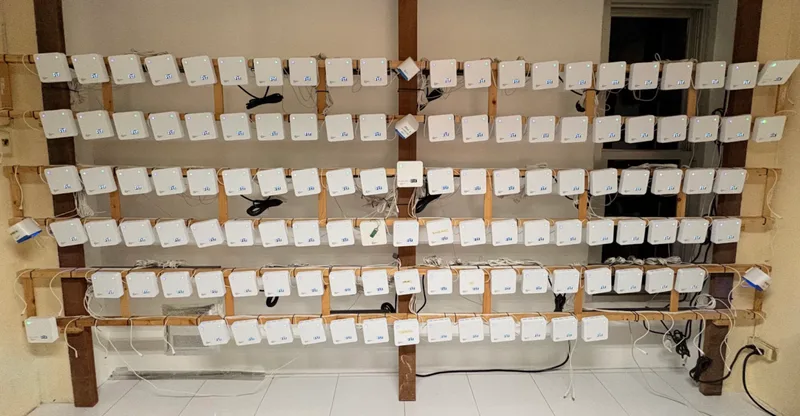
The factory calibration is performed individually for every single device prior to shipment. Calibration is conducted against a Palas Fidas 200S reference instrument using controlled incense smoke as the particle source. During this procedure, sensor readings are compared against the reference across a concentration range of approximately 0-60 µg/m³.
Based on this comparison, a scaling factor and offset is derived and applied to align the device’s PM₂.₅ readings with the reference instrument. Each calibrated unit is issued an individual test certificate documenting the calibration results. Below is an example of a monitor test report.
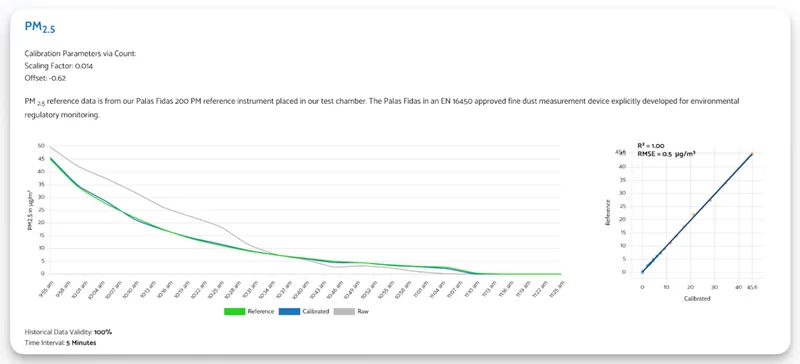
The EPA algorithm (documented here) can then either be applied to the raw data or on top of the factory calibration.
CO2
AirGradient devices use high-quality, low-cost NDIR CO₂ sensors from SenseAir. These sensors are well suited for building, classroom, and workplace environments, but are not intended for atmospheric background or regulatory-grade ambient measurements.
The sensors utilise an automatic baseline correction (ABC) algorithm to maintain long-term stability. This auto-calibration feature can be disabled if required, and the calibration period can be adjusted depending on deployment conditions.
Raw CO₂ concentration values (ppm) are provided directly from the sensor, and all configuration and processing parameters are accessible via firmware.
NO2
The AirGradient device utilises the Alphasense A43F electrochemical NO₂ sensor, which outputs an analogue voltage signal. This signal is converted to concentration (ppb) using the manufacturer-provided conversion formula from Alphasense.
For NO₂ validation and calibration, we use an AQMS-600 reference analyser from Focused Photonics Inc. (FPI). This instrument is compliant with the US EPA reference method for ambient NO₂ measurement.
Similarly to our particulate matter calibration approach, we perform a linear regression comparison between the AirGradient device and the AQMS-600 reference analyser. Based on this comparison, calibration parameters are derived to align the device output with the reference instrument.
Raw and calibrated outputs both remain accessible.
O3
AirGradient devices use an electrochemical ozone sensor that outputs an analogue voltage signal. This signal is converted to concentration (ppb) using the manufacturer-provided conversion formula.
At present, we provide the converted raw concentration values only. No additional regression-based field calibration is applied to ozone data.
TVOC and NOx
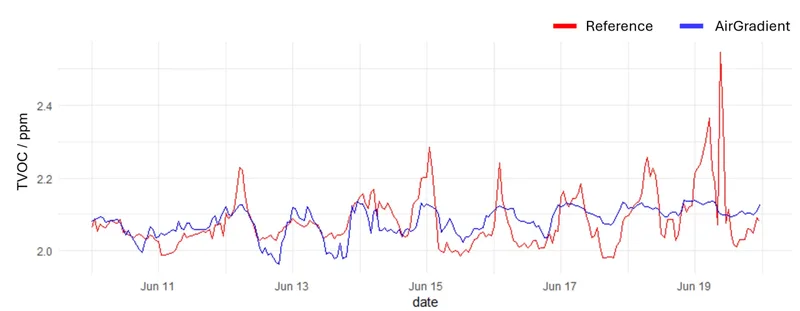
For TVOC and NOx, AirGradient devices report values using the Sensirion VOC Index and NOx Index as the primary output. These indices are calculated directly using Sensirion’s standard signal processing algorithms and are designed to reflect relative air quality changes in indoor environments.
Raw index outputs are provided for full transparency.
In addition, we offer derived “absolute” concentration values. These values are calculated using Sensirion’s documented conversion methodology, as described in the referenced Sensirion technical documentation. The conversion approach and underlying assumptions are fully documented by the sensor manufacturer in the linked PDF.
AirGradient has comprehensively characterized the TVOC performance of the SGP41 in a blog post accessible here.
Temperature and Relative Humidity
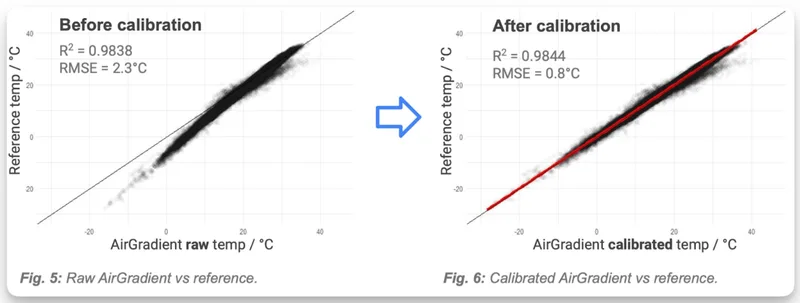
All AirGradient devices provide raw temperature and relative humidity outputs directly from their respective sensors.
For the AirGradient Open Air (O-1PST), temperature and humidity are measured using the integrated sensor located inside the Plantower PMS503T PM module. Due to the sensor’s placement within the enclosure and airflow path, raw values may not fully reflect true ambient conditions. To address this, we conducted an extensive analysis using more than 200,000 temperature data points, from which the following calibration algorithms were derived.
This correction applies only to the Open Air (O-1PST).
The AirGradient ONE and Open Air Max use dedicated Sensirion SHT41 temperature and humidity modules, which provide significantly higher intrinsic accuracy and do not require this correction. All temperature and relative humidity data from these devices is raw from the SHT41.
Open Air (O-1PST) Standard Calibration
Temperature
- Below 10°C: T(calib) = Traw × 1.327 − 6.738
- Above 10°C: T(calib) = Traw × 1.181 − 5.113
Relative Humidity
- RH(calib) = RHraw × 1.259 + 7.34
- Values exceeding 100% are capped at 100%.
Raw values remain accessible even when a correction is applied.