Once every two years, the Better Air Quality Conference takes place in a city in Asia. This year, it was held in Bangkok, Thailand, where our team had the opportunity to organize two sessions – one of which was the Bangkok Air Walk, an urban walkability tour.
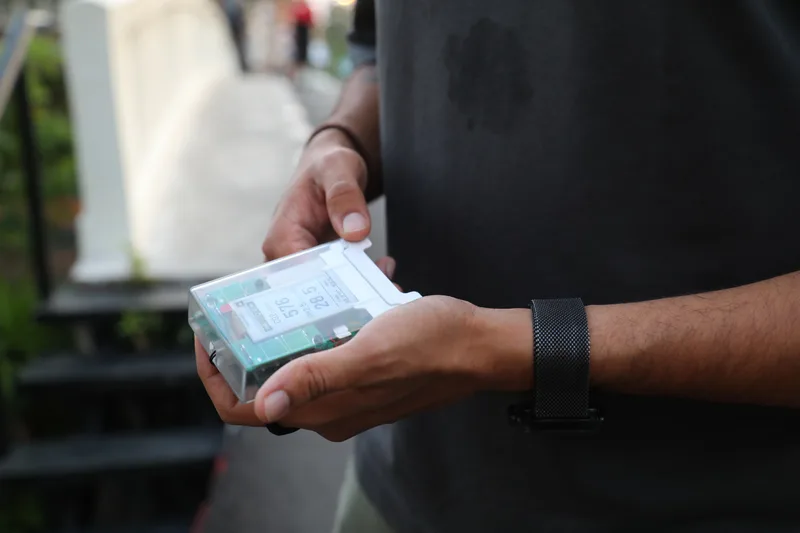
As you may know, we recently launched preorders for our new portable air quality monitor, the AirGradient Go. Around the same time it was being developed, we were brainstorming what activities we wanted to organize for BAQ. Given these two things were happening at the same time, it was only natural that we designed an activity centred around personal exposure monitoring.
With this in mind, we saw an opportunity to introduce the AirGradient Go in a way that allowed people to experience it for themselves, in real-world conditions.
Designing the Walkability Tour
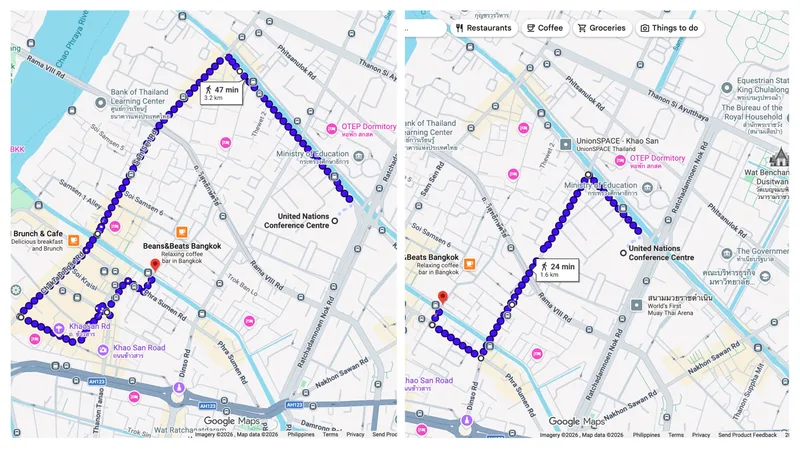
The activity itself lasted for about two hours, with participants walking from the conference venue to Duklong café – a spot just a few minutes away from the starting point. Though the total session ran for two hours, the walk itself took less than an hour. Participants were given the option to choose from a longer route (47 minutes) or a shorter one (24 minutes), while the remaining time of the activity was spent on discussing initial observations and cooling down after the walk.
It might seem like arranging a walk like this would be as simple as picking a start and end point, but it had to be a lot more intentional than that. Our Product Success Manager, Altaïr, was in charge of organizing the entire activity. As someone who isn’t based in Bangkok, it was especially challenging for him to come up with routes that would capture a range of urban settings while ensuring the safety of the participants. To make sure both of these considerations were met, he tested several walking routes together with our Technical Support team member, Tai.
Tai and I actually walked the routes ourselves beforehand to plan them carefully. We tried to balance participant comfort (given the Bangkok heat and a full conference day) with making sure the routes would still pass through meaningful pollution sources. That balance wasn’t easy.
What made the planning process even trickier was that we decided to change things up a few days before the activity. To make the experience even more interactive, we wanted to launch a live feed where people who were at the conference venue could follow along. For context, each group would be given a few monitors – the one held by the group leader would be connected to the dashboard and live feed, while the others were disconnected, and meant only for participants to see air quality variations on the spot.
Measuring What Gets Missed
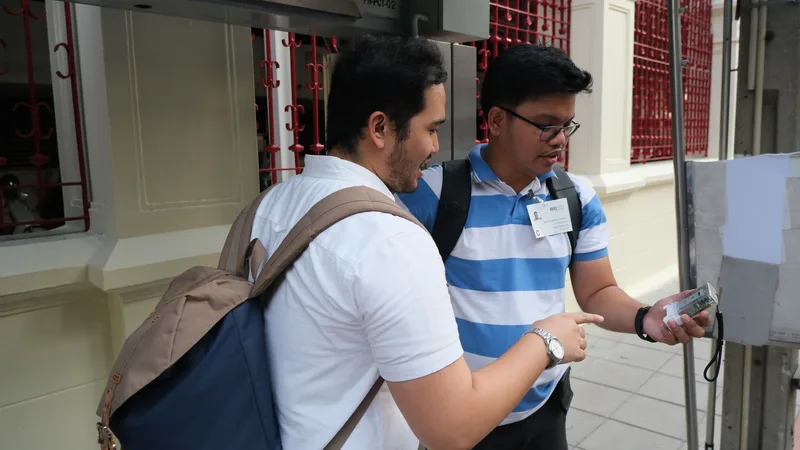
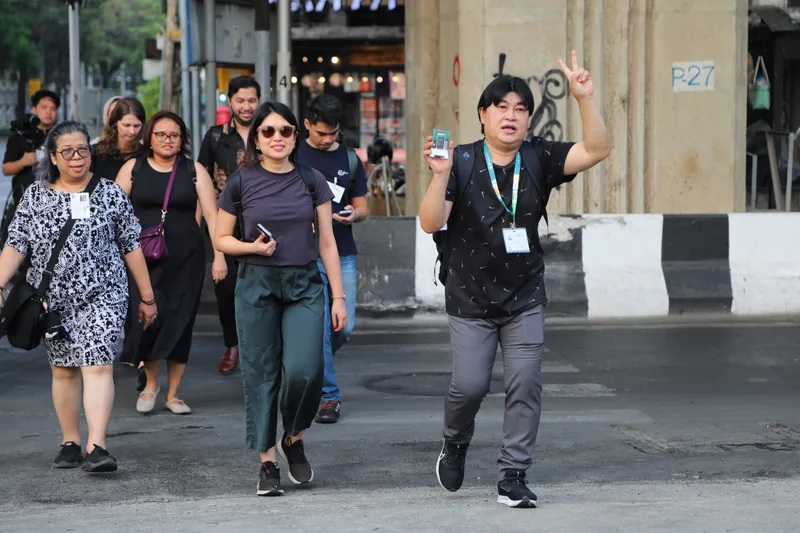
On the day of the walk, the AirGradient team split up to lead the groups. To our surprise – considering the heat at the time – most people opted for the longer route, while I led the only group that chose the shorter one. We staggered the departure times so that groups taking the same route left at different intervals. This gave us a chance to see whether the pollution hotspots we encountered would be the same across different times, or if leaving just a few minutes earlier or later would actually change what people were exposed to.
Within our 24-minute walk, our group noticed immediate PM2.5 spikes at traffic intersections and when passing under bridges with cars overhead. These weren’t subtle shifts either, as you could see the numbers jump within seconds, then drop again just as quickly once we moved past the source. The groups taking the longer route made similar discoveries. Two different groups independently noticed PM2.5 spikes when passing by the same street vendor, while another group recorded elevated levels near a construction site.
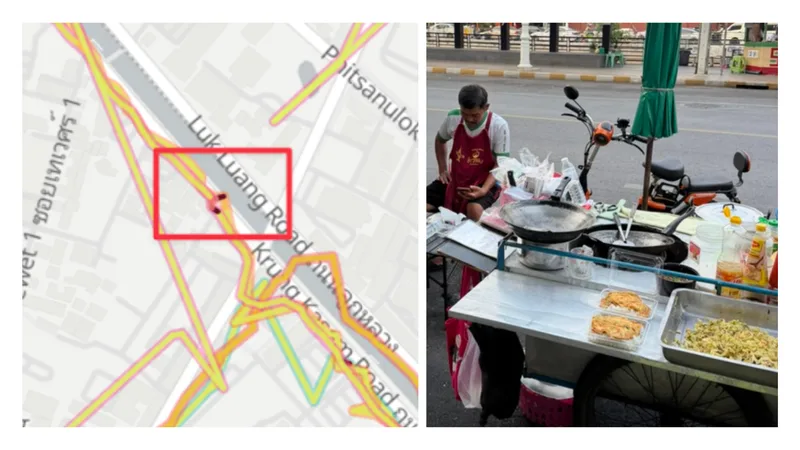
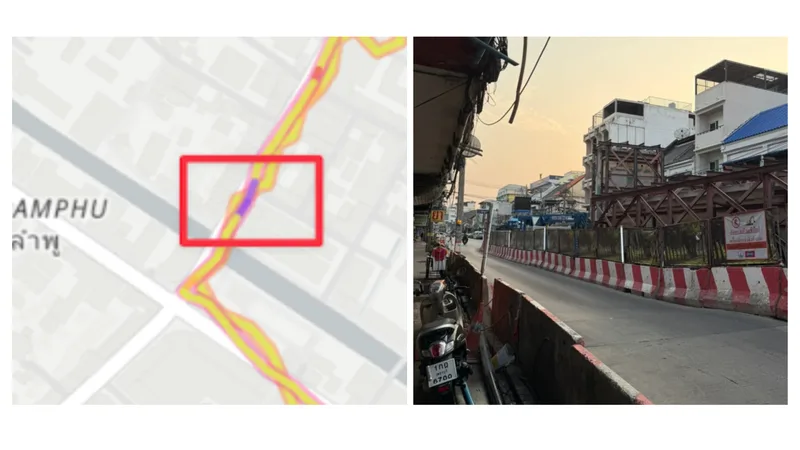
Overall, we noticed how localized and short-lived these spikes could be, and how a few steps in one direction could mean a completely different exposure level – demonstrating exactly what fixed monitoring stations miss. What was also interesting to see was how engaged and observant everyone was, regardless of which route they took. This was something Altaïr noted as well:
“What stood out most to me was people’s reactions. You could literally see faces change; whether it was surprise at sudden PM spikes or the opposite, when levels were lower than expected. That moment of ‘Oh wow, I didn’t expect that here’ really clicked for people. It made me realize how powerful this kind of tool can be for awareness and clean air advocacy.”
Local Insights, Bigger Questions
Organizing an activity like this is meant to leave a mark, and the Bangkok Air Walk did exactly that. At the end of the session, several members of my group were already thinking about how they could replicate something similar within their own communities, which told me the experience had resonated with them.
Sometimes, we don't really actively think about the air we’re breathing on our daily commute, on the way to work or school, or during a morning run. But the moment you put a monitor in your hand and watch the numbers shift as you move through a city, something changes. Suddenly, things such as the route you take, the time of day you go out, or where you’re walking matter. And that's really the value of personal exposure monitoring.
At the same time, it doesn’t stay at the level of personal choices. Once you see the data up close, it’s hard not to think about the people who don’t have the option to change their routes or timing, such as street vendors, drivers, or anyone who spends long hours outdoors. That's where monitoring like this becomes less about individual decisions and more about asking what actually needs to change – safer pedestrian routes, cleaner public transport, and better infrastructure that doesn't leave certain people stuck breathing the worst air.
The monitor itself isn’t a solution on its own, but watching participants map out those hotspots in real time and seeing them start to connect the dots between what they measured and who's affected most felt like a decent starting point.