Comparing Indoor and Outdoor Data on the Same Graph
Comparing Indoor and Outdoor Data on the Same Graph
If you have both indoor and outdoor monitors, you can overlay outdoor data on indoor parameters to compare them.
a) Go to your indoor monitor in the dashboard
b) Click a parameter (e.g. PM2.5) to open the graph

c) Select an Outdoor Data Source
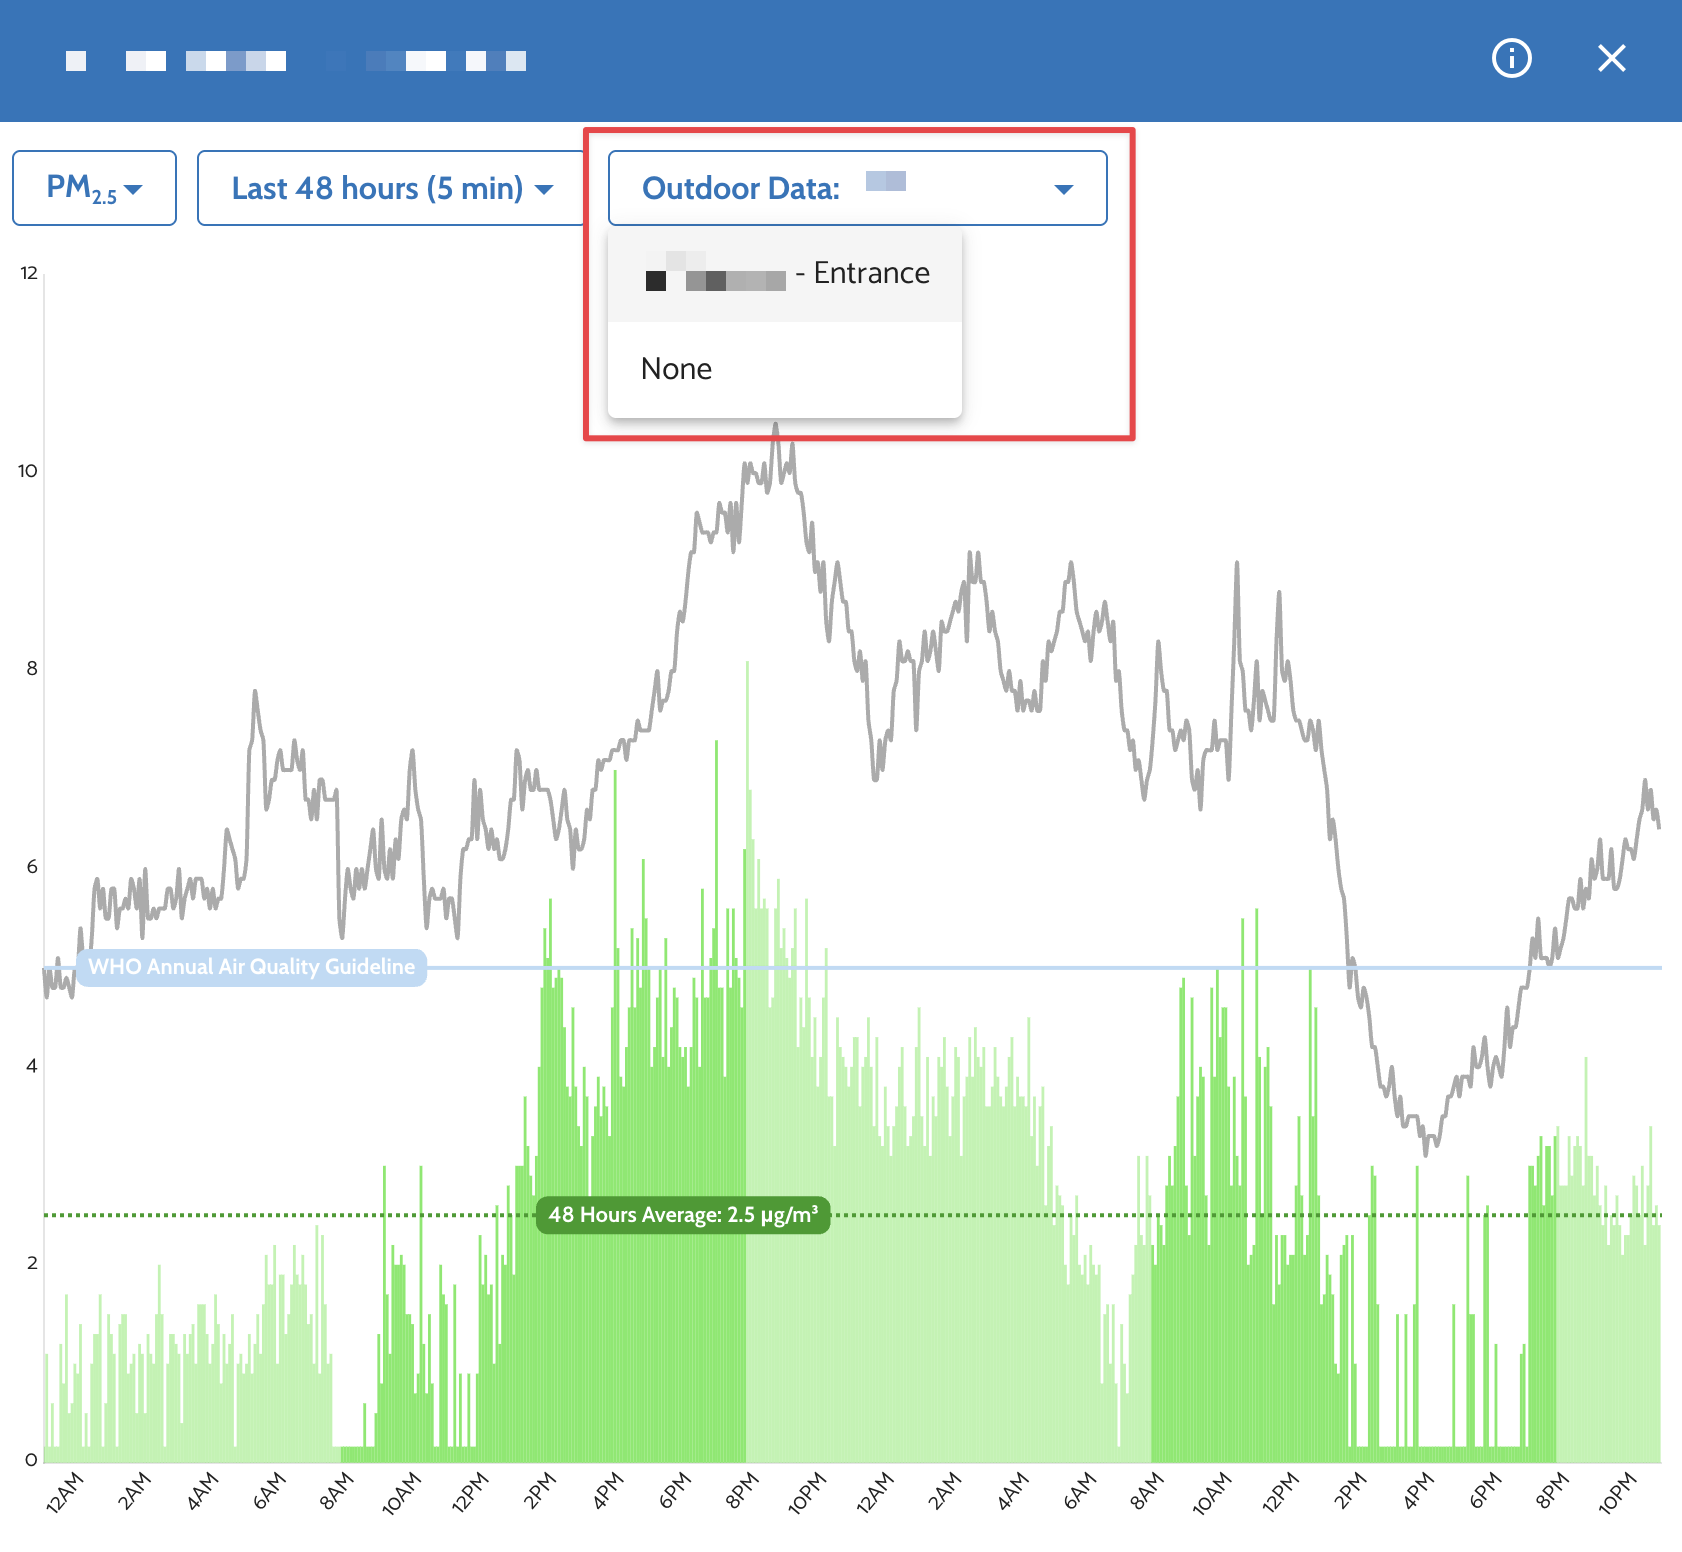
The outdoor graph data will then appear on the same graph for direct comparison.
For an explanation of the Reduction (%) value shown in the dashboard, including how it is calculated, see What does Reduction mean in the AirGradient Dashboard?