When we started building the AirGradient Go, we had a clear idea of what we wanted: a portable, open-source air-quality monitor that is transparent in its design decisions and genuinely useful outside a lab. The Go is meant to be carried - from room to room, into a restaurant, onto the street, into a car, back home. Portability is the entire point.
That's exactly why selecting a CO₂ sensor became one of the hardest hardware decisions we've made.
For context on the AirGradient Go and its core design goals, see the original Go announcement.
A Critical Note Before We Begin
Important context: All three sensors we tested are designed primarily for indoor air-quality applications. We are asking them to survive conditions-direct sun, rapid temperature changes, motion, vibration, indoor-outdoor transitions-that fall outside their typical design envelope.
This article is not about blaming manufacturers. These are all good sensors engineered for specific usage profiles. Our goal is to understand which technology remains most predictable when the AirGradient Go is used the way people will actually use it.
We also did not have a laboratory-grade reference instrument. Throughout this analysis, we treat the optical NDIR sensor (Senseair S12) as our reference because it showed the most stable behavior.
Why CO₂ Matters
CO₂ is one of the most important measurements in a consumer air-quality device because it connects directly to actions people can take.
Indoors, CO₂ is a strong indicator of ventilation. High readings often mean air isn't being refreshed quickly enough-affecting comfort, cognitive performance, and general sense of air quality.
In shared spaces-restaurants, classrooms, gyms, offices-people intuitively understand "it's crowded," but don't necessarily grasp how quickly air degrades without ventilation. A portable device makes this visible.
Outdoors, portable CO₂ can serve as an indicator near idling traffic, congested intersections, or industrial zones. We don't claim the Go is a scientific atmospheric instrument, but it offers another way of making invisible phenomena visible. For a few years our stationary outdoor monitors measure CO2 and comparisons with reference instruments show high levels of accuracy.
That's why the Go needs a sensor that behaves well not only in stable indoor air but also in the messy reality of portable use.
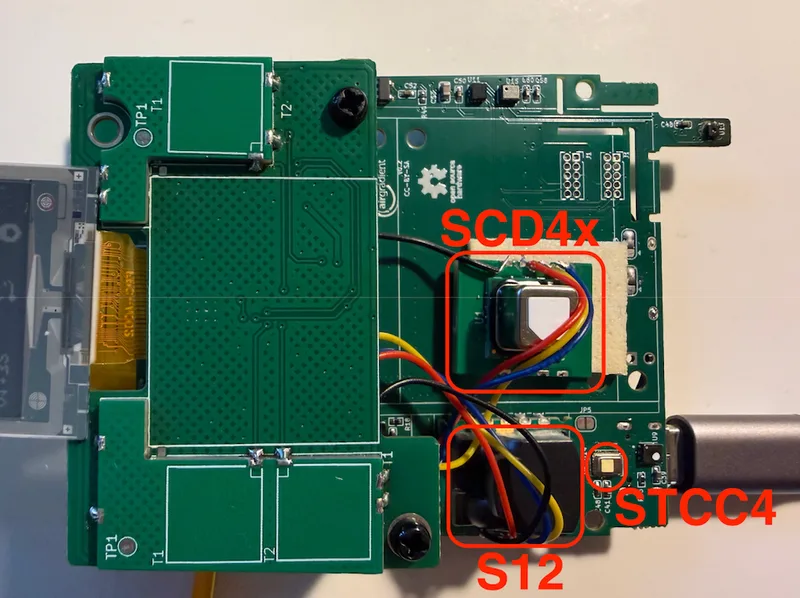
The Three Sensors We Tested
The small enclosure of the AirGradient Go, made it necessary to focus on small CO2 sensors. We selected three sensors representing fundamentally different measurement approaches:
Senseair S12 (Optical NDIR)
A new and very compact NDIR sensor designed for low-power IAQ monitoring. Senseair lists a range up to 10,000 ppm and an operating temperature of -10 to 60°C. NDIR remains the most established approach for consumer CO₂ monitoring.
Sensirion SCD4x (Photoacoustic NDIR)
A photoacoustic sensor in a very small form factor. Unlike traditional NDIR, it uses sound waves generated by CO₂ absorbing pulsed infrared light. The compact size makes it attractive for portable devices.
Sensirion STCC4 (Thermal Conductivity)
A fundamentally different approach-not optical. Sensirion highlights very low power consumption but also notes several constraints relevant to portable use: warm-up behavior after idle periods, an "initial operation" requirement of up to 12 hours before full accuracy, and calibration assumptions around periodic fresh-air exposure.
| Sensor | Technology | Size (mm) | Accuracy Spec | Power | Primary Use Case |
|---|---|---|---|---|---|
| Senseair S12 | Optical NDIR | 18 × 15 × 7 | ±(30 ppm + 3%) | <34 µA avg, <20 mA peak | Indoor IAQ |
| Sensirion SCD4x | Photoacoustic NDIR | 10.1 × 10.1 × 6.5 | ±(40 ppm + 5%) | ~15 mA during measurement | Indoor IAQ |
| Sensirion STCC4 | Thermal conductivity | 4 x 3 x 1.2 | ±(100 ppm + 10%) | <100 µA single-shot | Indoor IAQ |
These three technologies differ in how directly they measure CO₂. Optical NDIR detects infrared absorption by CO₂ molecules - a direct physical measurement. Photoacoustic NDIR adds an intermediate step: it detects sound waves produced when CO₂ absorbs pulsed infrared light, which could make it more susceptible to vibration and acoustic interference. Thermal conductivity measures how the gas mixture conducts heat - inherently temperature-dependent by design.
For a stationary indoor monitor, these differences may not matter much. For a portable device experiencing motion, temperature swings, and environmental transitions, a more direct measurement principle is likely to be more predictable. Our test results appear to support this.
How We Tested
We built a special version of the AirGradient Go with all three sensors installed in the same enclosure, allowing side-by-side comparison during identical real-world events.
Test methodology:
- Duration: 3 days of testing across 5 distinct sessions
- Environments: Stable indoor air, restaurants, cars, indoor-outdoor transitions, outdoor walking
- Polling interval: Approximately 5-60 seconds
- Sensor placement: Not identical within the enclosure, so small timing differences due to airflow paths and thermal gradients are expected
Our goal was not laboratory-grade accuracy verification. We wanted to evaluate real-world behavior and product suitability for a portable monitor.
Key Findings Summary
Before diving into details, here's what we found:
| Condition | S12 (Optical NDIR) | SCD4x (Photoacoustic) | STCC4 (Thermal Conductivity) |
|---|---|---|---|
| Stable outdoor air | Very stable (~10 ppm wander) | Stable (~26 ppm wander) | Noticeable drift (~136 ppm wander) |
| Indoor tracking (restaurant) | Acts as reference | Tracks well, slight offset | Closer in absolute ppm, noisier fit |
| Indoor-outdoor transitions | Predictable and fast | Predictable but slower | Predictable and fast |
| Extended outdoor use | Stable | Acceptable | Strong temperature correlation |
| Overall confidence | High | Moderate-High | Low for portable use |
Detailed Analysis
1. Stable Ambient Air Test
To test the sensors in a stable CO2 environment, we put them outside for testing and forced a calibration to 400ppm at the start of the experiment. Below is the chart of approximately 90 minutes testing.
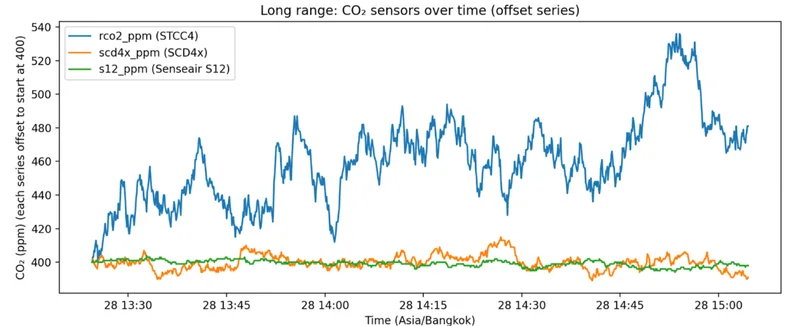
We can see the drift of the STCC4 clearly which is also reflected in the quantitative analysis:
| Metric | S12 | SCD4x | STCC4 |
|---|---|---|---|
| Peak-to-peak variation | ~10 ppm | ~26 ppm | ~136 ppm |
| Standard deviation | ~1.84 ppm | ~4.46 ppm | ~25.47 ppm |
| Sample-to-sample noise | ~0.38 ppm | ~0.89 ppm | ~3.11 ppm |
The STCC4's problem isn't fast noise-it's slow wander. Users don't experience sensors as statistics. They experience them as a line on a screen. If that line drifts in calm air, the product feels unconvincing.
It is important to point out that the observed deviations are still well within the manufacturers specifications of ±(100 ppm + 10%).
2. The Travel Test
The Go isn't supposed to live on a shelf. It moves through the world. That's why testing on the go matters more than static tests.
Portable use means rapid concentration changes, mixed environments, motion, and thermal disturbance. A sensor that only looks good when air is stable is probably wrong for this product.
So we took the Go on a trip. The measurement started in an airconditioned restaurant, then a brief period outside, then in the car (with only recirculating ventilation), then at home.
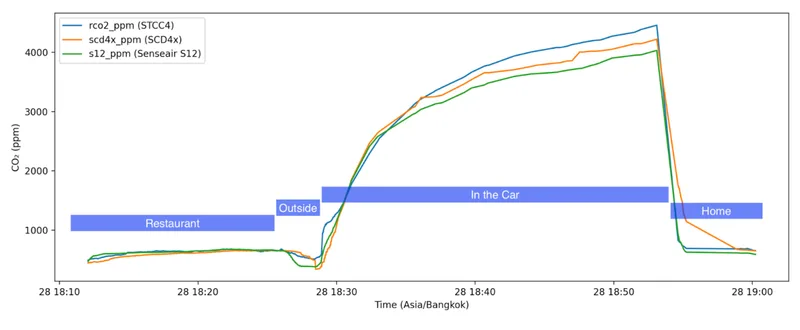
All three sensors track the conditions reasonable well when looking at the big picture. There is no sensor that fails completely. But we can also see certain differences already emerging:
- S12: Fastest reaction when stepping outside the restaurant and car. Smoothest curve, e.g. in the car when you can assume a very constant increase in CO2
- SCD4x: Occasionally showing jumps like it needs to catch up on its own measurement
- STCC4: Uneven concentration ramp up compared to the S12
Now let’s dive deeper into specific areas of the chart to better understand the differences.
3. Inside the Restaurant
The restaurant with people present is a very realistic indoor use case. Here is a zoomed-in chart:
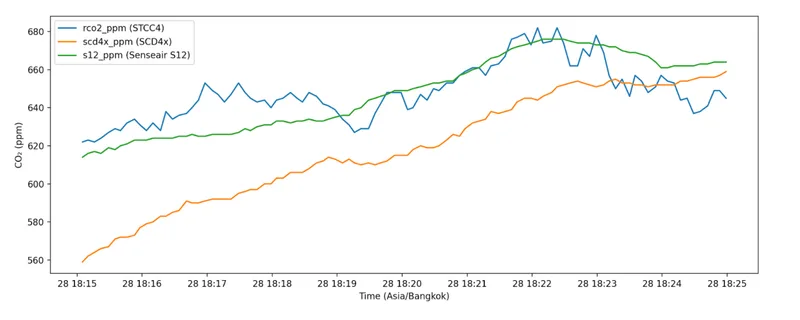
We can see again that the S12 has the least noise in its measurement and that the SCD4x seems to correlate better with the S12.
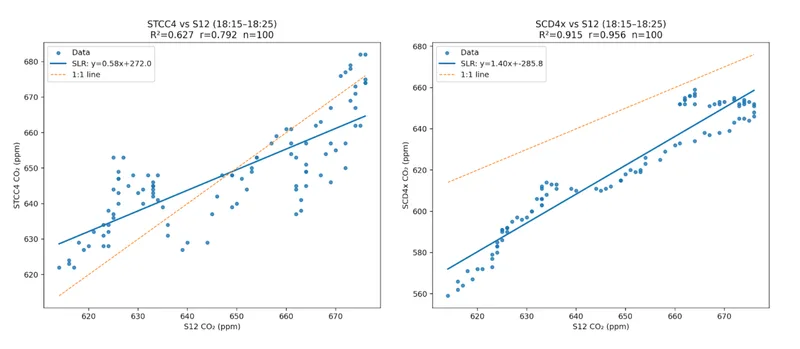
This becomes more visible with two scatter plots. Where we can clearly see that the SCD4x correlates with the S12 much better even though it has a higher offset.
4. Outdoor Behavior: Where Confidence Diverges
If the decision were based only on indoor segments, it would be easier. In stable indoor conditions, all three sensors are defensible.
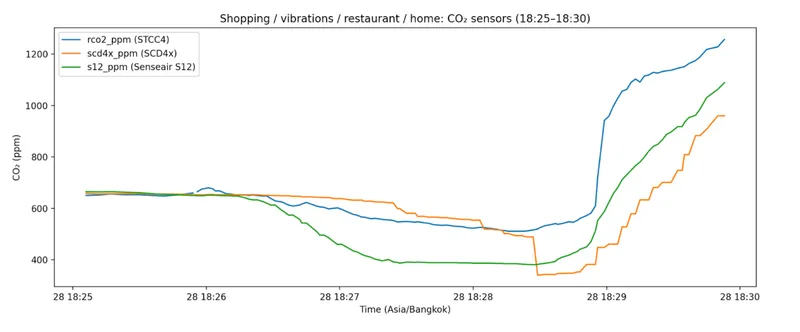
But the Go is portable. The revealing moments come when the environment changes abruptly-leaving a restaurant, stepping outside.
So let’s also zoom into the area when we stepped outside the restaurant. In the chart below we can see clearly how the three different sensors react to sudden CO2 changes. We can see that the S12 picked up the changes fastest, smoothest and also reached the ambient level of 400 quickest. The STCC4 never reached the ambient level, and the SCD4x shows jumps in its values.
When the STCC4 failed
In a different outdoor test, the STCC4 showed a concerning behavior. In one analyzed window, after applying a ~5-minute lag to account for thermal inertia, the STCC4 trace showed a Pearson correlation of ~0.991 with temperature-while its correlation with the S12's CO₂ trace in the same window was actually negative.
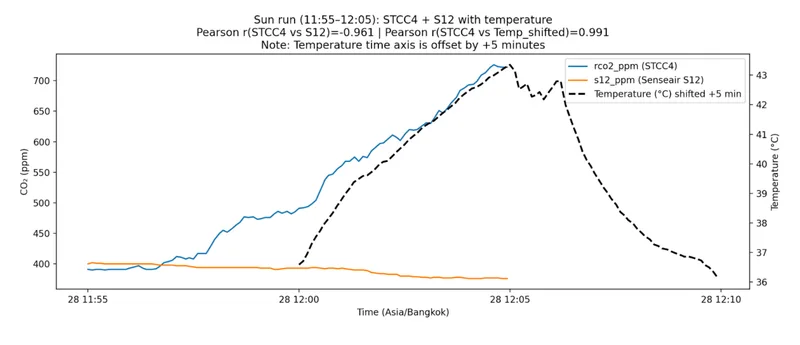
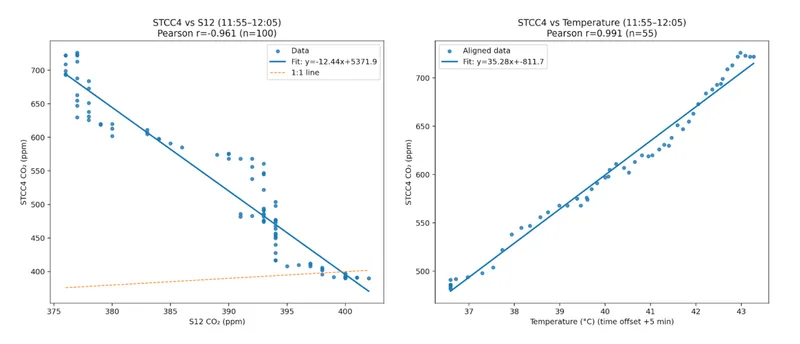
We want to be careful not to overstate this. This analysis was exploratory, not designed as a controlled experiment to prove thermal sensitivity. But results like this are exactly what makes us nervous to use it for the AirGradient Go monitor.
The STCC4 datasheet context matters here: Sensirion explicitly positions it for indoor applications. The documentation notes that accuracy after idle periods longer than 3 hours requires up to 1 hour of operation, and initial operation after first power-up can require up to 12 hours plus fresh-air exposure. We most likely did not fulfil this requirement in the above test - but it is also not something that we can expect a user to keep in mind when using a portable, battery powered device that is often switched off and on to be able to fulfil the requirements from Sensirion.
None of that makes the STCC4 a bad sensor. It means its assumptions are easier to satisfy in a stationary indoor appliance rather than in a portable monitor that gets carried outdoors, warmed by sun, cooled by wind, and switched on and off irregularly.
What This Means for the AirGradient Go
After this testing, our view:
Senseair S12 (Optical NDIR): Currently reads as the cleanest product choice. Consistently the trace we feel most comfortable treating as an reference. The specs and power profile look ideal for portable use. This is most likely due to its direct measurement of CO2 with optical NDIR.
Sensirion SCD4x (Photoacoustic): Noisier than the S12 and the jumps in readings are not ideal. However it still feels predictable in changing environments. But it generally still looks like a sensor trying to measure CO₂.
Sensirion STCC4 (Thermal Conductivity): Size, price and integration are extremely attractive. Calm indoor performance can look good. But the outdoor behavior, and calibration conditions that Sensirion lays out in its specifications make it very difficult to use as a reliable in a portable monitor. It also seems to have certain conditions where it fails completely (e.g. strong temperature dependency) and then does not recover by itself.
We did not make a final decision which sensor to use. The obvious choice is the S12, but it might not yet be available when we enter the market.
If the S12 isn't available in time, we face a trade-off between the SCD4x's and the STCC4's - in my opinion neither is ideal for a device built around portability, but the SCD4x is probably the safer choice.
We will continue testing the three sensor modules and hopefully further tests will allow us to come to a good conclusion.
In the spirit of open-source hardware, we'll keep publishing what we learn. Portable monitoring is inherently messy. But that's also why it matters: it reflects the air people actually breathe.
Have thoughts on this analysis or suggestions for additional testing? We'd love to hear from the community.