A few months ago, I wrote an article on the cost of inaction, and touched briefly on how frameworks like IIASA’s cost of inaction assessment can put a number on losses that governments have long treated as invisible. But quantifying those losses is only one step of the process. Once we know what we’re losing, the next question becomes: what do we actually do about it and how can we effectively address it?
This is where things can get quite complicated. Air pollution doesn't come from a single source. In a lot of places, it comes from motorcycles and trucks stuck in traffic, agricultural burning in rural areas, and factories that sit alongside residential neighborhoods. Each source contributes differently to what people breathe. Each intervention carries different costs and trade-offs. Acting on one without understanding the others can lead to expensive policies that deliver far less than expected, or create problems somewhere else entirely.
What's needed is a way to hold all of those moving parts in view at once in order to identify which sources contribute most to what people actually breathe, and what different policy choices would produce in terms of emissions reduced, health outcomes improved, and cost to get there. This is exactly what the Greenhouse Gas and Air Pollution Interactions and Synergies (GAINS) model, developed by the International Institute for Applied Systems Analysis (IIASA), is built to do.
The GAINS model
Building on decades of air pollution research through its predecessor – the Regional Air Pollution Information and Simulation (RAINS) model – GAINS was developed at IIASA as a tool to help researchers and policymakers trace the full pathway from emission sources through to their impacts on human health, ecosystems, and climate, and to understand what different policy choices would change along that pathway. It covers around 3,500 emission control measures across eight major air pollutants and 350 options for reducing non-CO₂ greenhouse gases, holding all of them within a single framework.
In practice, the model works through what IIASA calls scenario analysis. You define a package of emission control measures – a shift in cooking fuels, a tightening of vehicle standards, stronger controls on industrial emissions – and GAINS calculates the resulting effects on emissions, ambient air quality, population exposure, health outcomes, and the cost of implementing those measures.
It is worth being clear about what this enables. Scenario analysis is not the same as finding the single cheapest route to a pollution target – that requires a deeper optimization process that IIASA conducts in collaboration with national teams. What scenario analysis gives you is something equally valuable: the ability to ask "what if?" and get a detailed, evidence-based answer.
The model's track record reflects how far that answer can reach. GAINS serves as an analytical tool for air pollution policy under the Convention on Long-range Transboundary Air Pollution (CLRTAP), particularly in negotiations surrounding revisions to the Gothenburg Protocol. The European Commission also relies on it for assessments tied to the EU’s air pollution strategy and Clean Air Outlook reviews.
What a scenario actually looks like
As mentioned earlier, GAINS can be applied across a wide range of pollutants and policy questions. For the purposes of this article, I want to focus on one example that illustrates its value directly: PM2.5 emissions by key sector.
The data behind each sector comes from a combination of sources: energy statistics from international energy and industrial statistics, and national emission inventories submitted by governments. GAINS draws all of this into a single framework and calculates the pollution output across every sector simultaneously.
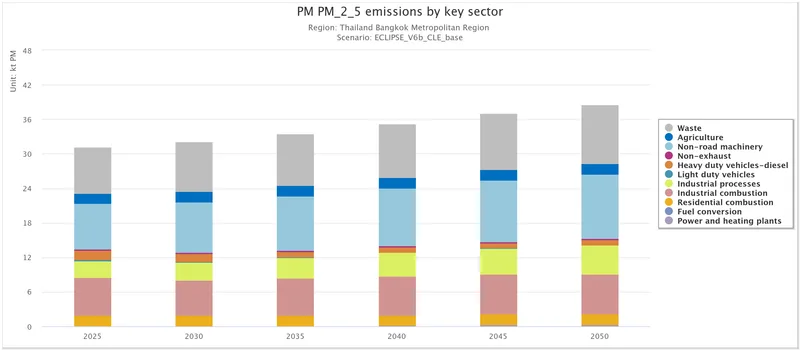
What you see above is a stack of coloured layers (one per sector) showing kilotonnes of PM2.5 produced per year in Bangkok, Thailand, stretching from the past out to 2050. This is the baseline scenario, known as CLE or Current Legislation: the trajectory if Bangkok implements only the controls already written into existing law and nothing more.
Adding in a second scenario changes the picture. This scenario applies MFR (Maximum Feasible Reduction) which means the most stringent technically available controls applied across every sector, while keeping the same underlying economic activity. The two scenarios now sit side by side on the same chart as scenarios A and B, and the difference between them becomes immediately readable. The layers in Scenario B are visibly smaller.
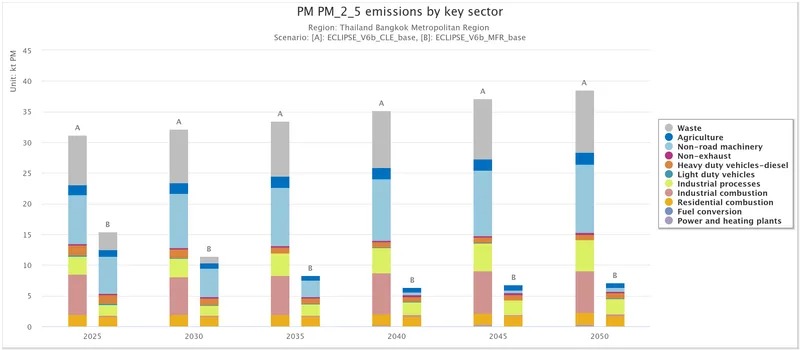
That sector breakdown is where GAINS earns its keep as a policy tool. In Bangkok, for instance, the breakdown reveals that waste and non-road machinery – not traffic or power plants – are dominant contributors to PM2.5 emissions under current legislation, and that it can remain stubbornly large even under maximum feasible controls.
Having data available on a chart like this enables a specific kind of conversation about the future. A ministry of environment can point to the waste layer and ask: what happens to that bar if we focus on better waste management? An agriculture ministry can see what reducing open burning would contribute to the overall picture.
Each scenario produces a concrete set of outputs: emissions reduced, air quality improved, health impacts avoided, and the cost of the measures required to get there. Not the theoretical cheapest route to a target, but the actual consequences of a real policy choice, quantified and made visible.
The PM2.5 sector breakdown is only one entry point into what GAINS offers. The same framework applies across multiple pollutants, sectors, and different kinds of policy questions.
What this means for countries still building their systems
One concern that comes up often in discussions about sophisticated modeling tools like this is accessibility. Can a country with limited institutional capacity actually use something like GAINS? The honest answer is that it requires investment in technical expertise, data infrastructure, and in coordination across ministries.
But the model itself is freely accessible online. GAINS estimates historic emissions based on data from international energy and industrial statistics, existing emission inventories, and data supplied by countries themselves, projecting forward in five-year intervals through 2050. This means a country with gaps in its monitoring data can still work with existing international datasets as a starting point, and build from there.
For countries that want to go even further with their analysis, IIASA offers collaboration arrangements that give national teams fuller access to the model's capabilities. This is currently what scientists in many nations do to assess emission reduction potentials in their own regions.
A tool, not a substitute for political will
It would be too easy to conclude that models like these solve air pollution. At the end of the day, the decisions that models inform are still made by people operating within institutional constraints, competing priorities, and political realities that no algorithm can resolve. What tools like GAINS do is remove one of the most persistent excuses for delay: the claim that the trade-offs are too complex to evaluate, or that there simply isn't enough information to act.
And yet, what this article has explored is only one corner of what GAINS makes possible. A single feature is already enough to reframe how a government thinks about where its air quality problem is coming from and where action will matter most. The rest of the model, from cost-effectiveness analysis to health impact mapping to greenhouse gas co-benefits, extends that clarity further still.
In many regions where rapid urbanization and economic growth continue to outpace air quality governance, "too complex" has historically been a reason to wait. A model that makes the full picture visible makes that excuse very hard to sustain. The tools to have this conversation well are already here. The question is whether governments are willing to look at what they show.