Building a portable air quality monitor means making a lot of compromises, and the hardest ones almost always involve the battery. We never had to think about this with our other models, the ONE or the Open Air, both of which are USB powered, but we first encountered this challenge with the Open Air Max, which relies on a solar panel and internal batteries. However, a solar-powered stationary monitor is worlds different from a portable one due to portability and size constraints.
This meant that many of the decisions we made during development of the AirGradient Go had battery life on one side of the seesaw. A bigger battery means a heavier device, and a heavier device is one people are less likely to carry. Faster reading intervals give you richer data but drain the battery cell much quicker. GPS is one of the most useful features on the Go, but it's also one of the hungriest components on the board. Every decision pulls in two directions, and almost every time battery life needs to be considered.
Once we'd settled on the core components (many of which were chosen due to their low power consumption), we decided to play around with the battery life, and how this differs depending on the configuration of the Go. In fact, Achim got so invested in testing the battery life that he went out of his way to make a battery life simulator, and that is what I want to introduce to you today.
We're still genuinely uncertain which settings and configurations will ship with the launch version of the Go, and that's where the community comes in. We’d love for you to try the simulator and let us know your thoughts on the forum. Are there too many adjustable options for configuring battery life? Should some decisions be made for the user upfront? Your input will help shape what ships.
How to Use the AirGradient Go Battery Simulator
The simulator has two modes. We'll get to the manual one shortly, but Smart Daily Use is the one I'd start with because it's a bit simpler to use and reflects what most users will want to adjust.
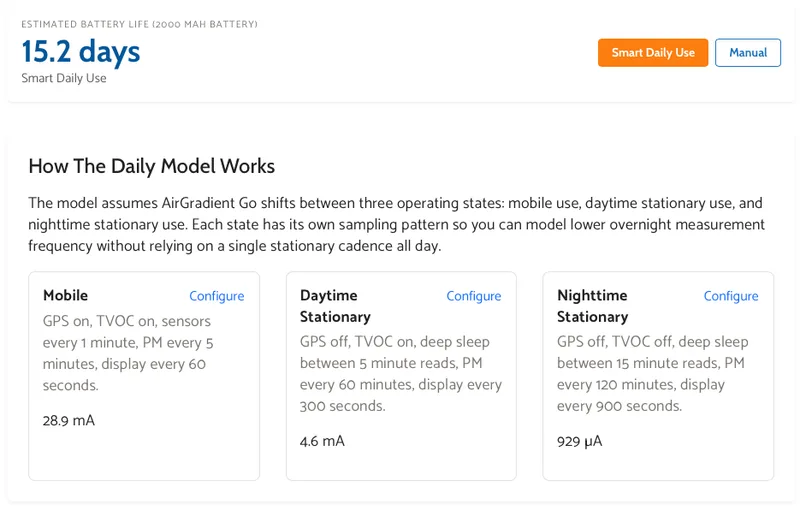
Rather than assuming the device runs at a single fixed setting all day, this mode lets you toggle between three operating states: mobile, daytime stationary, and nighttime stationary. Each has its own default configuration, and you set how many hours per day the device spends in each one. A commuter profile, for example, assumes two hours of mobile use, fourteen hours of daytime stationary, and eight hours overnight. A 24/7 monitor stretches the daytime stationary window much further. You can also build a custom pattern if none of the presets fit.
What makes this useful is that the three states behave very differently from a power perspective. Mobile mode runs with GPS on, TVOC active, sensors reading every minute, and PM every five minutes, drawing around 28.9 mA. Daytime stationary drops GPS, eases the reading cadence, and pulls just 4.6 mA. Overnight, the device steps down further still, with PM readings only every two hours and a draw of under 1 mA. Those differences add up significantly over a full day, which is why the commuter profile lands at 15.2 days while a device left in always-on mobile mode would die much quicker.
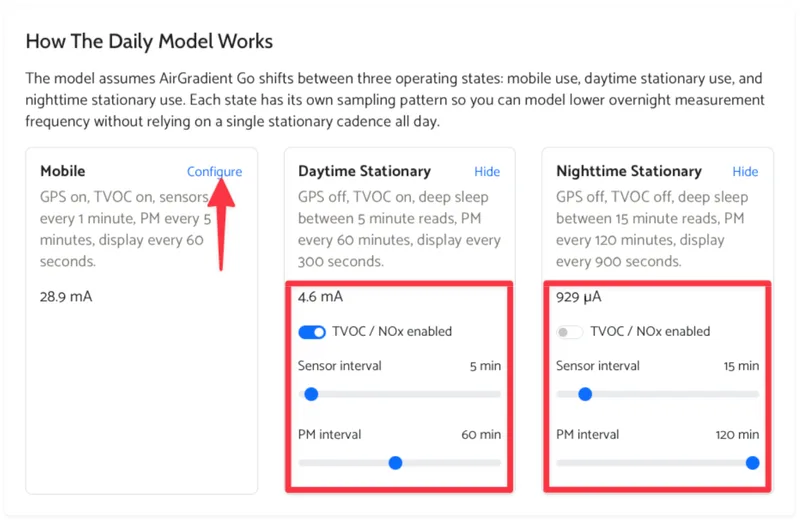
Each state is fully configurable if the defaults don't match your situation. You can toggle GPS and TVOC, adjust sensor and PM intervals, and the estimated current draw updates in real time as you go.
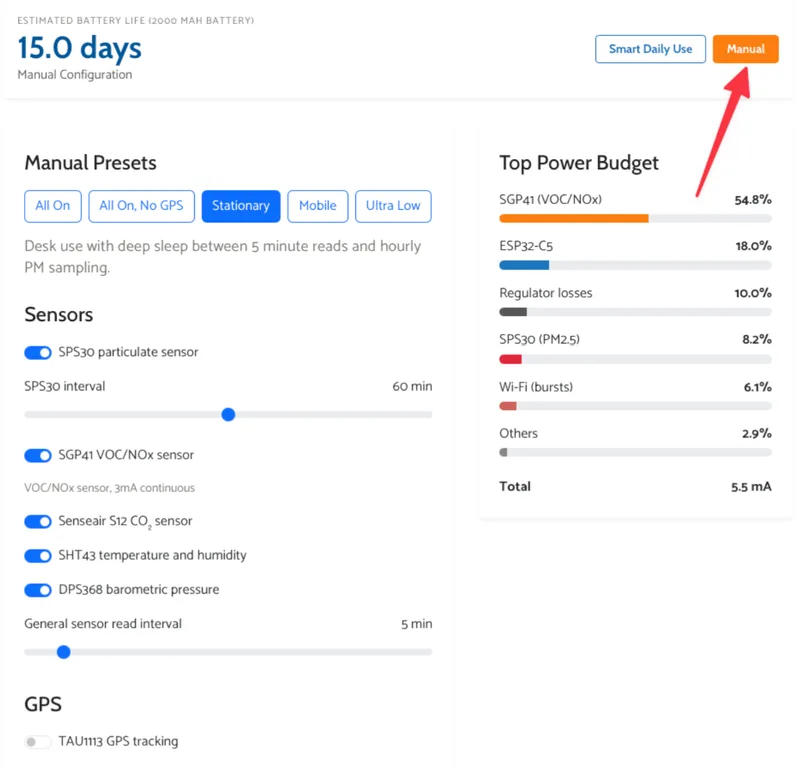
Manual mode is for anyone who wants to go deeper. Instead of modelling a day as a mix of states, you configure a single fixed profile and see what it gives you in terms of runtime.
The options cover pretty much everything. You can toggle individual sensors on or off, set the SPS30 PM sampling interval anywhere from every second to over an hour, adjust how frequently the other sensors read, enable or disable GPS, and control how often the e-ink display refreshes. Wi-Fi uploads can be switched on with a configurable upload interval, and MCU sleep behaviour can be set to automatic or manual.
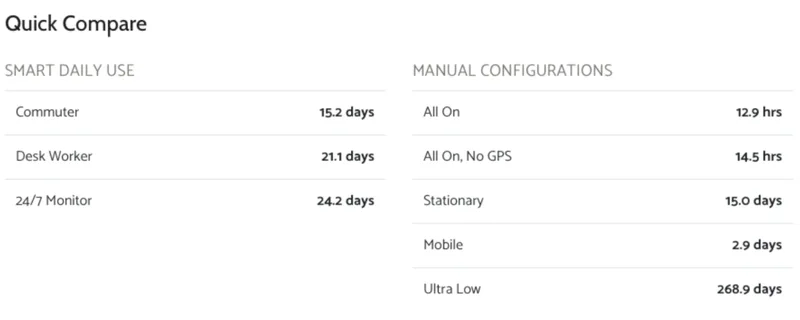
The quick compare table at the bottom gives a sense of the battery life range you can expect with different configurations. With everything running continuously, the 2,000 mAh battery lasts around 12.9 hours. Turn off GPS and that stretches to 14.5 hours. Switch to the stationary preset, which keeps sensors active but relaxes the cadence, and you're looking at 15 days. The ultra low configuration, which strips things back to the bare minimum, pushes the estimate to 268.9 days.
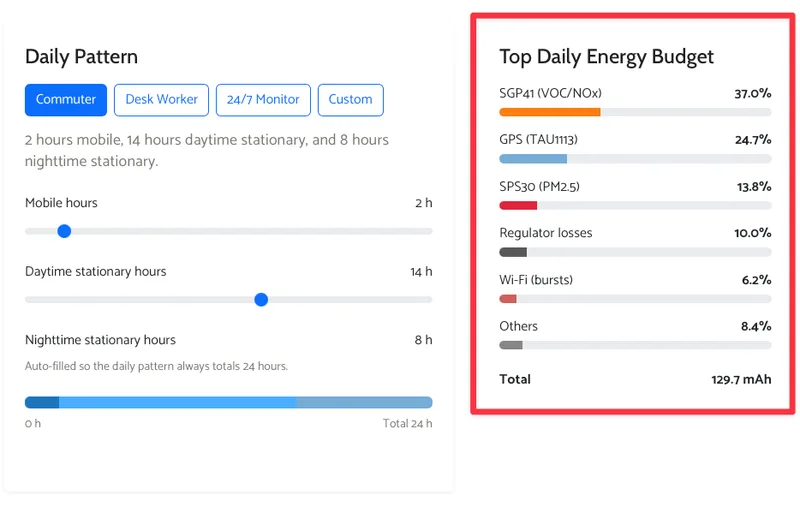
The power breakdown chart is, in my opinion, the most interesting part of the whole simulator. It shows exactly where the energy is going, and some of it is genuinely surprising (I didn’t know the SGP41 was so power-hungry. It turns out the sensor requires a 1 Hz polling rate, meaning it prevents the whole device from sleeping). In the commuter preset, the SGP41 TVOC and NOx sensor accounts for 37% of the total draw on its own - almost more than the GPS and PM sensor combined! These findings are why we created this simulator and why we want to hear your feedback - everything is a trade-off, and we want to know what’s most important to you.
How the Numbers Work
Before concluding this article, I want to highlight that the simulator is an estimate, not a guarantee. The numbers come from modelled component behaviour, representative sleep states, and the sensor and connectivity assumptions baked into the current Go design. Real-world battery life will vary depending on firmware tuning, environmental conditions, and how the final production units actually behave. We have compared real battery life to the simulator for the shorter lifespan estimations, and these have been quite accurate. However, we’ve not yet tested the lower power options.
Battery self-discharge is also factored in as a hidden background loss, modelled at around 2.5% per month. This mainly matters for very low-power configurations where cell ageing can start to dominate the final runtime figure, which is part of why that 268.9 day ultra low number should be taken with some scepticism.
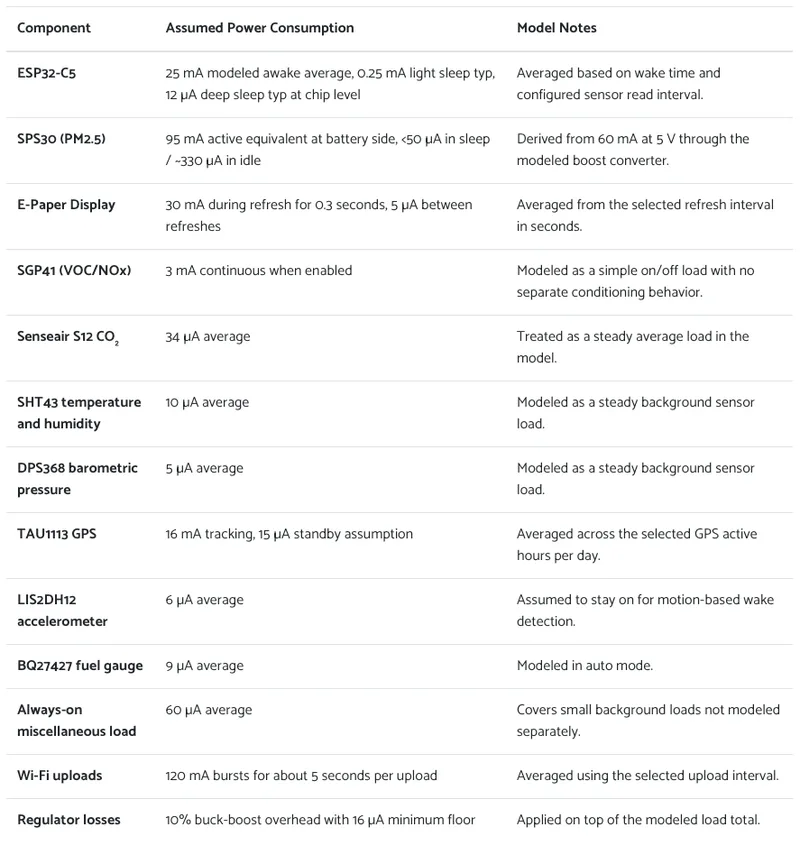
The simulator is a tool for comparing tradeoffs and getting a feel for expected usage patterns, but the exact battery life may differ. If you want to read more about the power consumption of each component, you can find that information at the bottom of the simulator page.
We want to hear from you!
We'd love to know what you think. Try the simulator, play with the settings, and come tell us on the forum what you find. We're still shaping what the launch version of the Go looks like, and there's one thing we're particularly keen to hear about: which configuration options are actually worth keeping. There's a fine balance between giving full control and shipping something that isn't overwhelming to set up. Should some of these decisions be made for you upfront? Are there options you'd never touch? Your input will help us find the right balance.
You can find the AirGradient Go Battery Simulator here.