The SGP41 is a small MOX (metal oxide) gas sensor from Sensirion that puts out two air quality signals, one for VOCs and one for NOx. We use it inside our AirGradient monitors (everything from the ONE to the Go), so understanding how far its NOx reading can be trusted was something we wanted to better understand. We've already put the VOC side through its own testing (results can be read here), and today we want to turn to the NOx half. In this article, we will look at controlled, indoor performance and in an upcoming article, we will take a deeper look at outdoor performance.
Before going further, however, it’s worth highlighting just how widely used this sensor and its technology are. The same MOX NOx sensing technology and Gas Index Algorithm sit at the heart of Sensirion's all-in-one platforms like the SEN6x series, which combine many pollutant sensors in one module. That makes NOx measurements very common across air quality monitors from many different brands, many of which use either a SEN6x series sensor or the SGP41 itself. If you have a low-cost air quality monitor in your home that provides an NOx output, it’s very likely to house this sensor or technology.
At this point, we've spent a good deal of time putting the SGP41's NOx performance through controlled indoor tests, dosing known NOx spikes and comparing the sensor against a calibrated reference analyser. We wanted to know how closely its NOx index actually follows real concentrations, how consistent it is from one unit to the next, and whether it lives up to the way it's intended to be used. What follows is a look at the kind of performance and accuracy you can really expect from these sensors indoors.
What Sensirion says the sensor is for
Now, to be clear, the product page describes the SGP41 as a VOC and NOx sensor for indoor air quality applications, designed as a digital smart switch and regulation unit for air treatment devices such as air purifiers. The idea is that the VOC and NOx signals, once processed by the Gas Index Algorithm, can automatically trigger a purifier or ventilation system when a pollution event shows up, then let it switch off once the event clears. The applications Sensirion lists for the sensor follow that theme: air purifiers, demand-controlled ventilation, indoor air quality monitors, and thermostats to name a few. The datasheet is also clear about the limit of detection (LOD) and range, putting the NO2 specified range at 50 to 650 ppb, which is well above the levels you'd see in normal outdoor air. The LOD also sits at 20 ppb, higher than you'd often see indoors but not unheard of.
So Sensirion is quite upfront about what this sensor can and can't do, and about the use cases it's built for. The problem is what happens downstream. These sensors show up in so many air quality monitors, and a lot of the companies fitting them haven't tested the sensor closely enough to know where its limits are. That gap gets passed on to the buyer. Consumers end up taking the NOx reading at face value, without a clear sense of what it actually means, when it can be trusted, or whether the number in front of them is accurate at all.
How the NOx index works
Now to the signal itself. The SGP41 doesn't report a NOx concentration, but rather an index. Inside the sensor, the NOx pixel produces a raw signal called SRAW_NOX that runs from 0 to 65,535 ticks and is proportional to the logarithm of the resistance of the sensing material. That material reacts to oxidizing gases, so both NO2 and O3 move it. On their own those raw ticks don't mean much, so they're fed into Sensirion's Gas Index Algorithm, which turns the raw signal into the NOx Index on a scale from 1 to 500.
The key thing is that the index is relative, not absolute. The algorithm keeps a moving average of the sensor's recent history, the past 12 hours (by default, but this can be changed by monitor manufacturers and we offer the ability for the user to adjust the baseline period on AirGradient monitors), and treats that as the baseline. The baseline maps to a value of 1. So an index near 1 means the current level of oxidizing gas is close to the recent average, which for most rooms, most of the time, means little or no NOx. An index above 1 means there's more NOx than the recent baseline, for example from cooking on a gas stove. Sensirion describes this as behaving like the human nose, which judges smells against what you were just breathing rather than on a fixed scale. The NOx index has no gain adaptation like the VOC index does, because the composition of NOx events doesn't vary as much.
The NOx Index describes the current NOx condition in a room relative to the sensor’s recent history. In this way, the NOx Index behaves like a human nose. Assuming that we are entering a room from outside, our nose will take the air composition outside the room as an offset (baseline) and provide us with feedback if it recognizes higher or lower levels of gases when entering the room.
All of this is to say that the sensor doesn’t provide a calibrated reading in ppb (either through the raw signal or the index), and it isn't supposed to. Sensirion put it plainly in correspondence with our team. The raw signal can't be used for a direct correlation to the index, and the algorithm affects both the baseline and the gain of the index value. It’s also mentioned in the spec sheet that NO2 is used as the proxy gas when the NOx response is characterised - not NO and NO2 as you might expect.
Before you ask why an index is used in the first place, it’s because MOX sensors measure a change in the electrical resistance of a heated metal-oxide film, and that resistance responds to oxidizing gases. The baseline resistance drifts over time, varies from one sensor to the next, and can even shift with temperature and humidity. So there's no fixed, lasting link between a resistance value and an absolute concentration that would provide accurate readings. The algorithm references the signal against its own recent history instead, which is what turns an unstable raw resistance into a steady, readable index.
Our Results
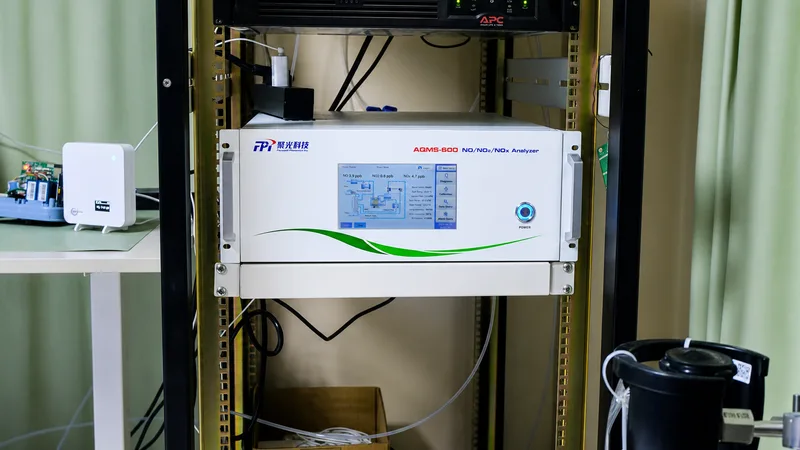
We ran the tests in our lab against an AQMS-600 reference analyser, set to measure NO2 specifically. The AQMS-600 can read NO, NO2 or combined NOx, and we chose NO2 because it's the proxy gas Sensirion uses to specify the NOx signal in the datasheet, even though the output is labelled NOx. The reference had been calibrated shortly before the tests.
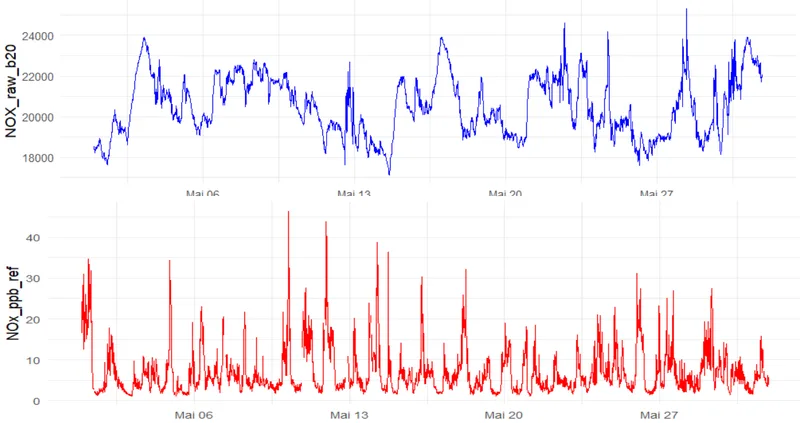
We'll start with the NOx index, since that's the output Sensirion promotes as its standard NOx signal and the number that usually reaches the user. In the first charts (figures 1-4), the right axis is the NO2 concentration from the AQMS-600 (in parts per billion, or ppb) and the left axis is the SGP41 NOx index (1-500). The coloured lines are five separate SGP41 units, SGP41 (1) to SGP41 (5), so you can see how closely they agree with each other.
We ran the spikes over the course of a week. Two large ones at 400 ppb, a pair of smaller spikes at 150 and 90 ppb, and one more at around 120 ppb. Spacing them across a week lets the index settle its baseline back to ambient between events, so each spike starts from a new baseline.
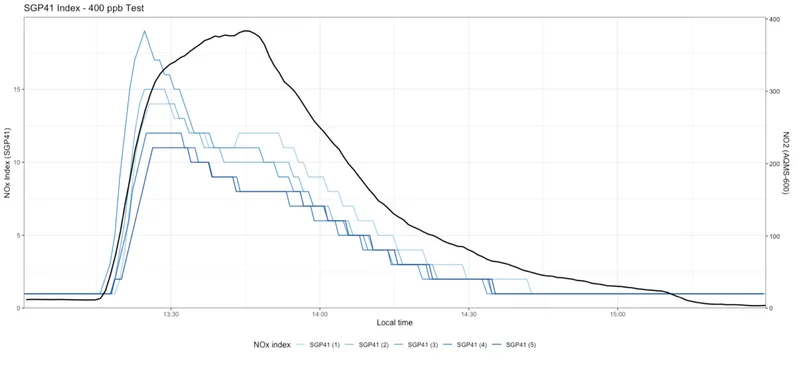
Figure 1 is the first 400 ppb spike, and it’s clear that the sensors caught the spike. All five rise sharply the moment the NO2 climbs, so as an event trigger the detection works. What they don't do is hold the shape of the reference. The AQMS-600 stayed over 300 ppb for half an hour or so, but the SGP41 units started dropping back after only a few minutes, while the real concentration was still high. They fell faster than the reference the whole way down, and reached their baseline of 1 while the actual concentration was still around 50 ppb. That early decline is most likely the index's baseline adjusting. There's also a fair spread in how high each unit peaked.
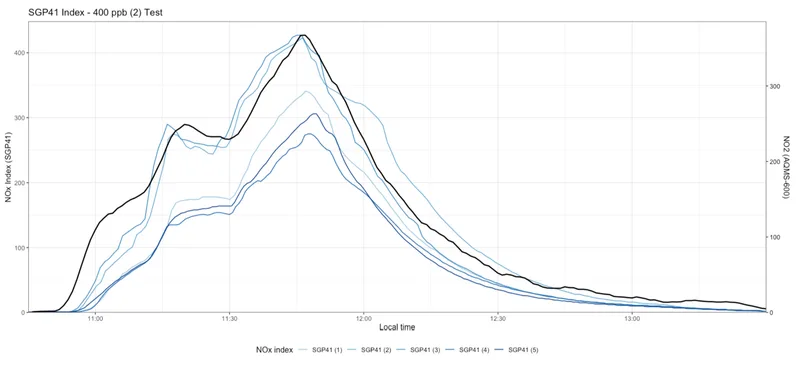
Figure 2 is the second 400 ppb run, and here the index follows the reference trend quite closely, rising and falling on much the same curve and peaking at the same time. What is particularly interesting here is the magnitude of the increase in the index values, with every SGP41 reaching an index value of at least 250, compared to the previous spike where they only reached 18.
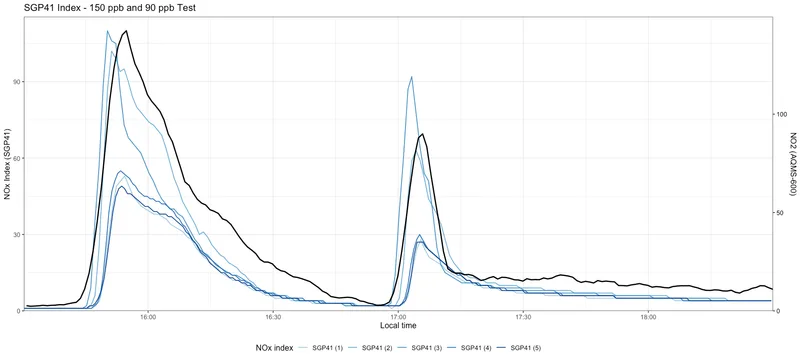
Figure 3 is the dual spike, 150 ppb then 80 ppb. Both events come through clearly, and again the sensors fall into two groups, one peaking near 110 on the first spike and the other only reaching about 50. The same quick drop shows up here too. On both spikes the index heads back toward baseline while the reference NO2 is still on its way down.
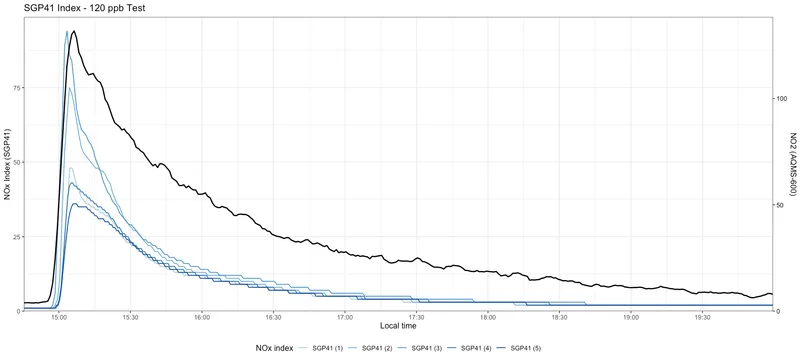
Figure 4, the 120 ppb spike, tells the same story. The sensors catch the event, fall into the same two groups, and drop back to baseline well ahead of the reference. The pattern across all four runs is consistent enough by now, so we wanted to take it a step further and look at the raw signal sitting underneath the index, before the Gas Index Algorithm processes it, to see whether the sensor itself does any better than its finished output suggests.
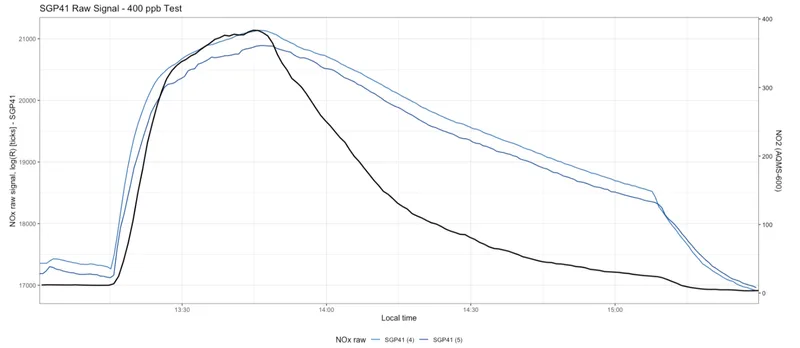
Before these, one caveat. Only two of our units are currently set up to output the raw signal, so figures 5 and 6 show a sample of two, SGP41 (4) and (5). We're looking to expand this and test a larger set in future, so treat this as an early look rather than a final result.
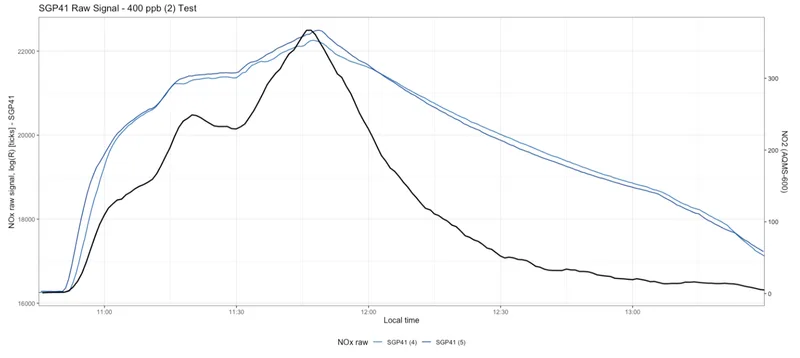
Figures 5 and 6 are the raw signals from the two 400 ppb runs, and both show the same trend. The two units sit almost on top of each other the whole way through, and they also tracked the reference well on the rise, following its shape up to the peak, including the early shoulder in Figure 6. Where they part from the reference is the decay. The raw signal comes down more slowly than the NO2 concentration does, staying elevated for a while after the real concentration has dropped back. So on the way down the raw signal lags, which is the opposite of the index, where the processed output fell to baseline faster than the reference did.
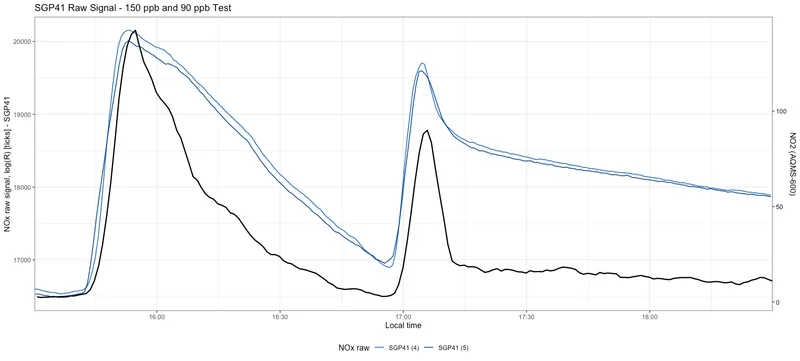
Figure 7 is the raw signal for the 150 and 90 ppb dual spike, and it repeats what the 400 ppb runs showed. The two units track each other closely on both spikes, rise cleanly with the reference, and then take their time coming down, staying elevated well after the NO2 has dropped. The slow decay is even clearer on the long tail after the second spike. So the tight agreement and the lagging recovery aren't just a high-concentration effect, they hold at these smaller events as well.
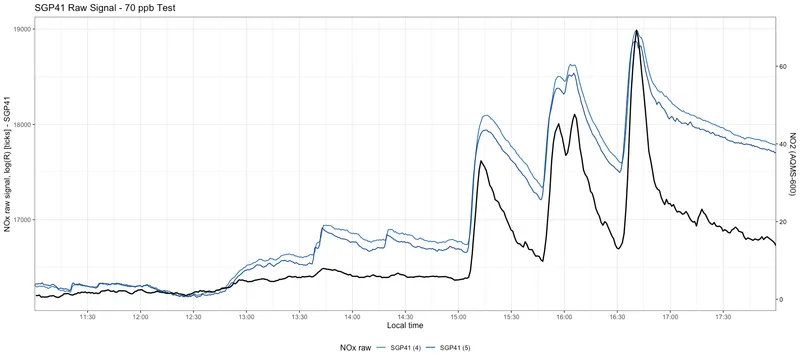
Figure 8 is the 70 ppb test, and by this point we were curious about the lower limit of the sensor. Could the SGP41 register increases in NOx below its limit of detection, the roughly 20 ppb the datasheet quotes? So we ran a series of smaller steps. Ideally we'd have held NO2 at set concentrations for 30 minutes at a time, but we can't yet hold the gas steady at a target level, so what you're seeing is closer to a run of spikes than clean plateaus.
The main behaviour is the same as before. The two units stay close together, and the raw signal is slow to come back down after each rise. The interesting part is the early section. Look at the small steps between roughly 13:00 and 15:00, where the reference NO2 is sitting well under 20 ppb. The raw signal still moves with them, stepping up each time the concentration nudges higher. So below its stated limit of detection, the raw signal is clearly still responding to real changes in NOx, even if it can't put a number on the concentration.
Our Conclusion
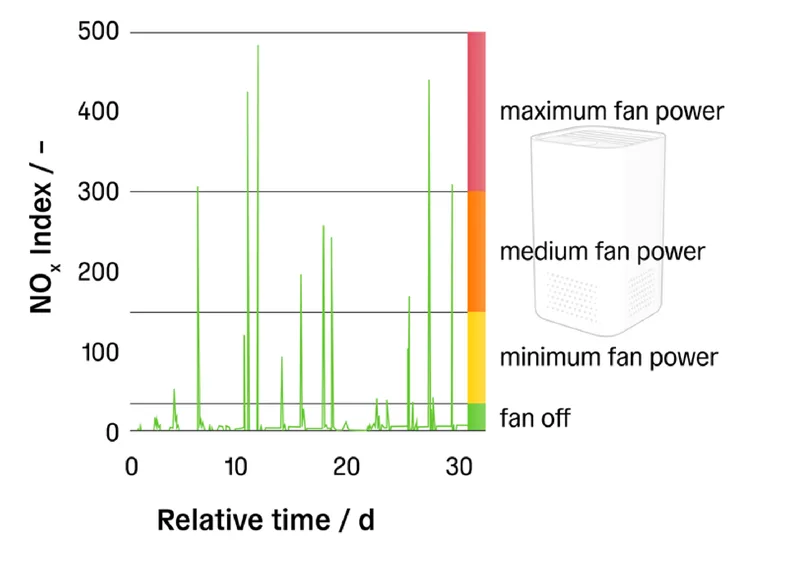
What's clear from these tests is that the index reliably detects sudden events. Every spike, all five units rose with the NO2, and quickly. What it can't do is put a consistent number on that event, and that's where we think Sensirion's suggested use case runs into trouble. Their own example, shown above, uses the NOx index to drive a purifier or ventilation fan, stepping the fan up as the index climbs. Two things we saw make that unreliable, and in some cases potentially unsafe.
First, the magnitude isn't consistent. In Sensirion's own example the fan doesn't even reach minimum power until the index passes about 30, with the higher settings above 150. But one of our two 400 ppb runs peaked at around 18. At that index value, a high concentration NOx event that is considered dangerous wouldn't have moved the fan off zero. The same 400 ppb dose reached an index value of over 400 on another run, so identical air can land anywhere from "do nothing" to "maximum power" depending on the sensor and the day. That's before we even look at between-sensor variability. If your ventilation triggers at a fixed index value, there's no guarantee a real event crosses it.
Second, and more concerning, the index is relative to a rolling baseline. It learns the recent surrounding air and treats that as normal. So if NOx stays high for a long stretch, the baseline drifts up to meet it and the index eases back toward 1, even while the real concentration is still elevated. We saw a short version of this in the spikes, where the index dropped back to baseline within minutes while the reference was still sitting at 300 ppb. In a home with a persistent source, that means the sensor can gradually get used to unhealthy air and stop flagging it, which is the opposite of what you want from something meant to control your ventilation.
The raw signal looked better, with the two logged units agreeing closely and even responding below the 20 ppb detection limit, but that's a sample of two and needs more work before we'd lean on it. And a reminder that all of this ran under lab conditions. The sensors behaved a certain way across our test suite, but that won't map exactly onto a real kitchen with its messier mix of gases and airflow.
We've also run the SGP41 outdoors, against reference-grade analysers in ambient air, and those results turned out to be even more interesting than what we've covered here. We'll be publishing them in the coming week.