As pollution is becoming more rampant worldwide, educators are deeply encouraged to teach students about the science of pollution and what they can do to care for the environment. From the release of greenhouse gases, worsening climate change, and burning of fossil fuels, the rate at which pollutants are produced is unprecedented. Hence, we have suggested 8 experimental ideas that teachers can use to actively involve their students to measure air quality. These ideas range from qualitative to quantitative methods and promote active discussion on which type of method would prove the most effective in producing reliable data. By measuring air quality, students can make sense of the different standards of air quality and recognize when it becomes appropriate to mitigate their effects. Without further ado, let’s jump into it!
PM 2.5 Meter
Particulate Matter (PM) 2.5 refers to particles or compounds which spans less than 2.5 micrometers in diameter. They are fine particles that are commonly produced from factories, vehicle exhaust, burning of crops or volcanic eruptions. Long-term exposure to high concentrations of these particles can put people at risk of developing respiratory illnesses, inflammation, trigger asthma and can even lead to lung cancer.
There are many types of PM 2.5 meters in the market, with some of them capable of measuring other types of pollutants as well. PM 2.5 is most commonly measured in units of µg/m3 (micrograms per meter cubed), or through AQI measurements (meter below).
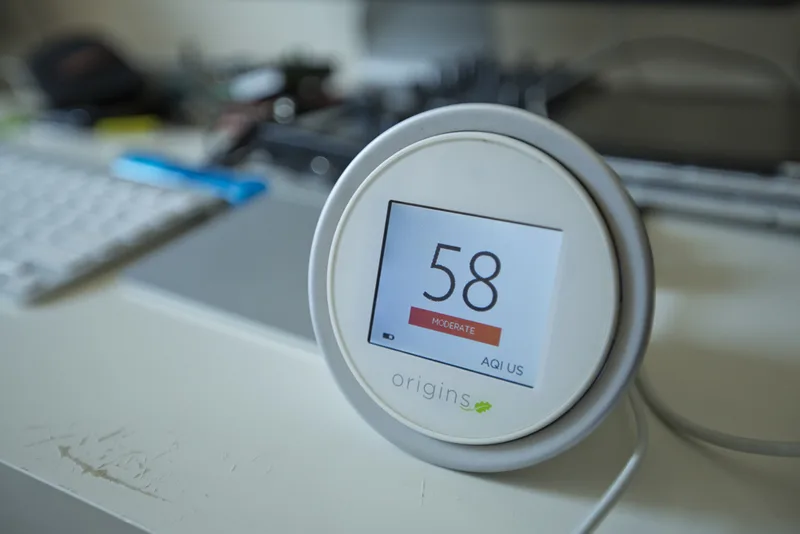
Depending on the meter you purchase, it may display either one of the units of measurement. However, keep in mind that the two measurements are not directly proportional to each other as measurements in µg/m3 are representative of the actual amount of PM in the area whereas AQI measurements are subjective to the air quality standards that have been internationally agreed upon for your particular region. This difference in proportionality is represented in the following graph:
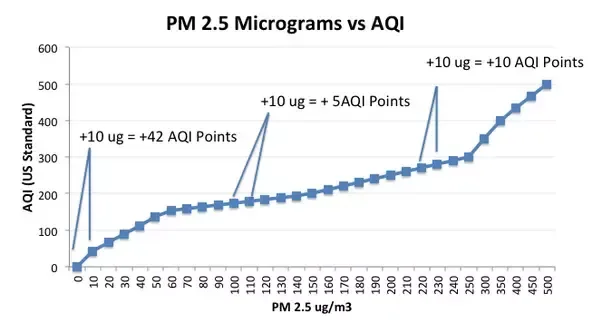
Having a corresponding AQI level alongside PM2.5 measurements can help students measure the precise amount of PM2.5 in a certain area and use them to determine the quality of the air. Students could measure air quality in different areas, comparing the results obtained and discuss the probable causes and sources of PM from the location. It is also a great way to measure quantitative values that are useful for writing scientific reports while reinforcing the numbers with a qualitative interpretation of the air quality.
You could perform these measurements with your students for a variety of experiments. For example, by comparing the PM measurements from outdoor areas to indoors, students would become aware of the differences in air quality and discuss the possible outdoor/indoor pollutants that may cause one to have higher PM levels than the other. Another great experiment would be to compare the PM levels of rooms that use purifiers and those that do not. This would demonstrate the effectiveness of air purifiers to students and how they are beneficial to maintaining their general wellbeing.
The following graph compares the different levels of PM 2.5 and US AQI PM 2.5 measurements provided by sarta.innovations2019.org:
Blue Sky Test
The color of the sky is a reliable qualitative method to measure air quality. The color can change due to airborne particles that reflect and refract light. For example, a blue sky would indicate little to no air pollution whereas bright red ones are a result of heavy pollution.
The University of Southern California developed an algorithm through its mobile sensing project to measure the air quality by analyzing pictures of the sky taken from the Android app that they created. The pictures that would be taken would take into account the user’s location, orientation, time taken and transfer the data collected into their server. It would calibrate the image and compare it with their own model of the sky.
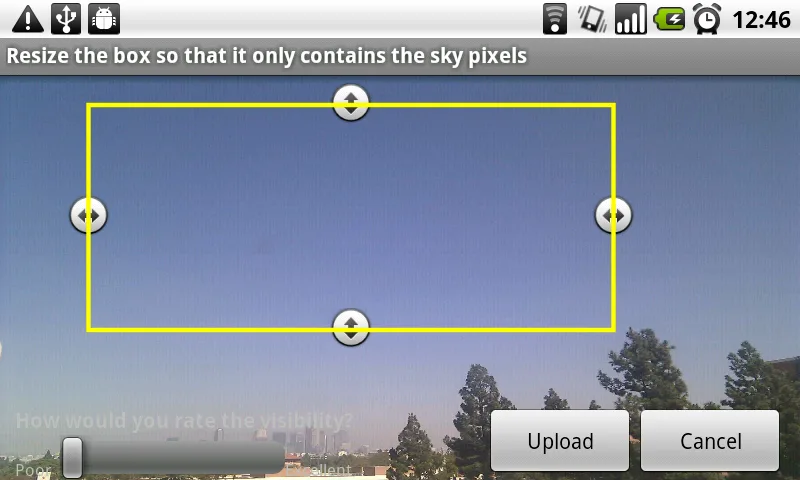
Although their app isn’t officially listed in the Play Store, all you have to do is click this link from your Android mobile device and click ‘Download Android App’ on from their website. If your phone is preventing the download, click here to find out more about installing APK files on your phone.
Mountain Visibility Test
Similar to the blue sky test, checking the visibility of mountains, or a large construction that can be seen from a long distance is also a qualitative indicator for air pollution. When we see places that are more polluted, we easily recognize the thick haze and dust that clearly obscures the view. But if we live in a polluted area, a clear view of mountains or other constructions may seem foreign in comparison as demonstrated from the following pictures provided by the US National Park Service:
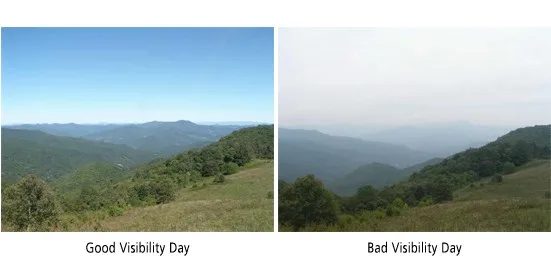
This method measures visibility as an indicator of air pollution. A great idea is to get in touch with schools from different areas to see if they would like to collaborate to gather picture samples of their view. This way, teachers could show their students what mountains or distant constructions from various places look like. This can prompt a discussion about why some areas are more visible than others while explaining how air pollution impacts the view.
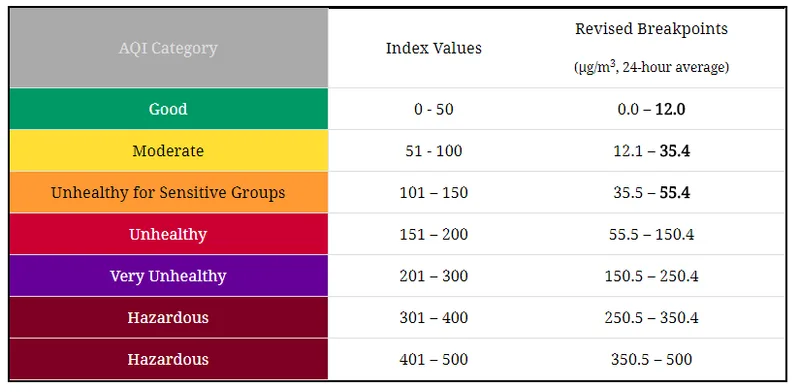
Students could also compare the images with public available AQI data from the region and see if there is a direct correlation between the AQI and visibility. Using the previous AQI Index table, students would be able to understand the different standards of air quality and associate it to qualitative observations on their surrounding environment. Furthermore, you could perform this experiment using AQI websites such as AirVisual or aqicn.org to identify the AQI values of different locations worldwide and compare it with images of landmarks in a particular country from which students could effectively assess the visibility.
This is a simple and easy qualitative analysis that can be performed anywhere in the world. However, it is advisable to make observations in the morning when there is the least fog and other factors impacting visibility.
Sticky Tape Method
Although the most dangerous particles are smaller in size, it is still a good indicator of air pollution to also measure the amount of larger particles such as dust, soot, dirt, smoke that can be potentially seen.
The sticky tape method is very simple, all you have to do is cut a small piece of transparent sticky tape and attach it to the bark of a tree or the surface of a building. Leave it for 10 seconds to let any PM on the surface stick onto the tape, peel the tape off and stick it onto a piece of paper. Students should be advised to label the time and location at which they took the sample.
Students could perform experiments by either collecting tape samples in the same location over different periods of time or taking samples in different locations at a certain period of time depending on their chosen independent and dependent variables. They can make qualitative observations of how PM levels change in different times and locations. This can be expanded by discussing the possible reasons as to why some areas or times have more PM in the air than others.
Lichen Observation & App
Sulfur dioxide (SO2) is a gas with a pungent scent which is known to be harmful towards our health. It is mostly generated from the burning of fossil fuels from industrial processes such as the generation of electricity from burning coal. It reacts to evaporated moisture in the air to produce several acidic compounds such as sulfuric acid, which can cause acid rain when dissolved in rainwater, leading to the acidification of forests.
Nitrogen can also be an overlooked pollutant as it is a common constituent in fertilizers and organic waste from households and sewage. When they have washed away into water bodies, it increases the acidity of the water, causing numerous wildlife deaths and disrupting the ecosystem. Like sulfur dioxide, it also causes acid rain when neutral nitrogen particles react with lightning in the air and mix with rainwater.
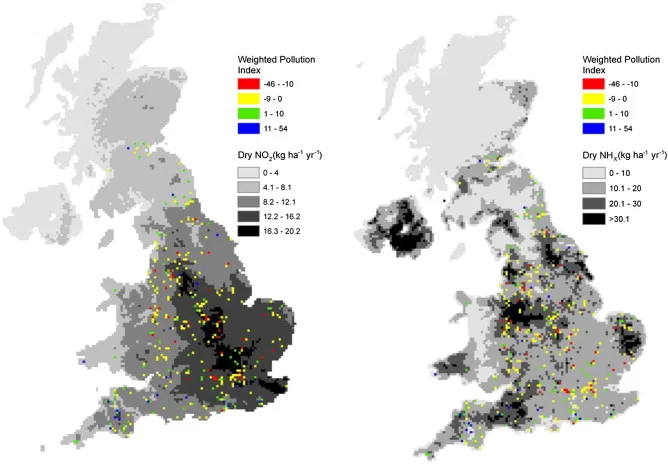
Lichen is an effective bio-indicator of sulfur and nitrogen pollutants. If lichen is a naturally occurring substance in your area, it will not be present if they are in the air and there would be green algae in its place. Many more species can act as a bioindicator for particular pollutants depending on vegetation that are sensitive or tolerant to them. A massive study was conducted using lichens to measure the air quality throughout the UK by the OPAL Air Survey.
The study conducted modeled the relationship between lichens as a bioindicator, nitrogenous pollutants, and their climate. Furthermore, the data was easily collected by everyday citizens throughout the UK and can be performed as school experiments as well. The map of the UK on the left demonstrated the amount of nitrogen dioxide (NO2) around the country while the one on the right referred to NHx radicals such as ammonia (NH3) and ammonium (NH4), which can cause ammonia pollution. The following image is their result:
The UK Centre for Ecology & Hydrology developed the Lichen Web-App, which provides guidelines on how to identify what type of lichen is suitable for testing, how to perform chemical tests on them and a comprehensive list of different species that are sensitive or tolerant towards nitrogen. It also enables you to track and record any trunks and branches that have lichens on them. They also created a measurement system called Nitrogen Air Quality Index (NAQI) to accurately associate the different levels of nitrogen to indicate their corresponding level of air quality.
Students could emulate this study on a much smaller scale and explore their environment for lichen or other similar species. This would also make them aware of how vegetation is often sensitive towards pollution.
Palmes Passive Diffusion Tubes
Nitrogen can exist in many forms, one of them being nitrogen dioxide (NO2). Nitrogen dioxide is a gaseous pollutant produced from the burning of fossil fuels such as those in power plants and vehicle exhausts. It undergoes a process in which neutral nitrogen (N2) and oxygen (O2) particles react in high temperatures to produce nitrous oxides (NOx) including NO2, all of which can inflict respiratory conditions such as inflammation, coughing, irritations, etc. This is clearly demonstrated from the image on the right which was performed in an experiment from the University of Edinburgh.
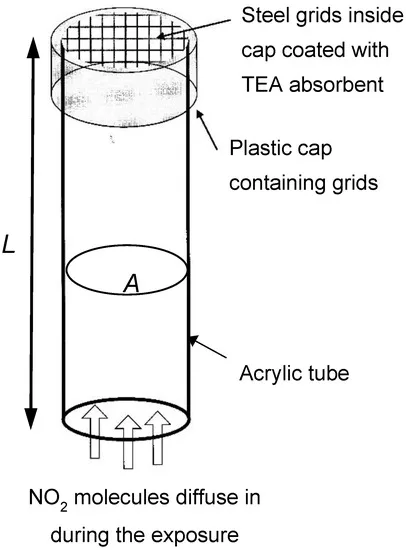
Passive diffusion tubes are an effective long-term method to measure nitrogen dioxide. These small plastic tubes contain a mesh disc made of steel covered with a chemical called triethanolamine (TEA). If nitrogen dioxide is present and passes through the mesh, it would react with TEA and change the color and chemical composition. Diffusion tubes can measure the change in nitrogen dioxide levels over many months inside classrooms or outside your school based on how much TEA is left in the tube.
Ozone Testing Experiments
Ozone (O3) is a gas that is popularly known as a gaseous layer in the stratosphere which protects the earth from harmful UV radiation from the sun. However, ones at the troposphere are mainly the result of the chemical reactions between nitrous oxides (NOx), volatile organic compounds (VOCs) and the sunlight. At high concentrations, they can cause chest pains, coughs, throat irritations and are especially harmful to those suffering from respiratory conditions such as asthma.
We can test for the presence of ozone in two different ways:
Ozone badges are very simple and can be made into different forms. All of them rely on a change in color when high concentrations of ozone are present. The badges as seen from the image are commercially produced indicators that are commonly used by workers who are required to operate in areas with elevated ozone concentrations.
For a more advanced chemical experiment, you could also perform the Schoenbein experiment. Students would require cornstarch and potassium iodide to make indicator strips that would react with ozone if present in the air, evidently turning blue or purple. According to the resulting Schoenbein number from the color scale below, we can determine the amount of ozone present in parts per billion (ppb) as seen from the following from the graph.
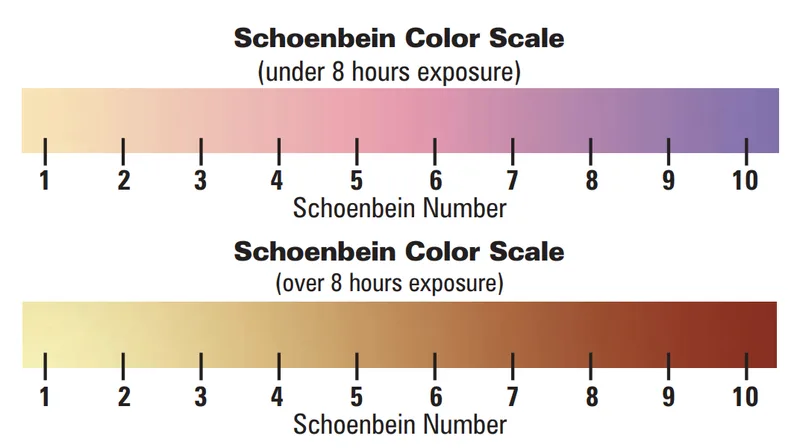
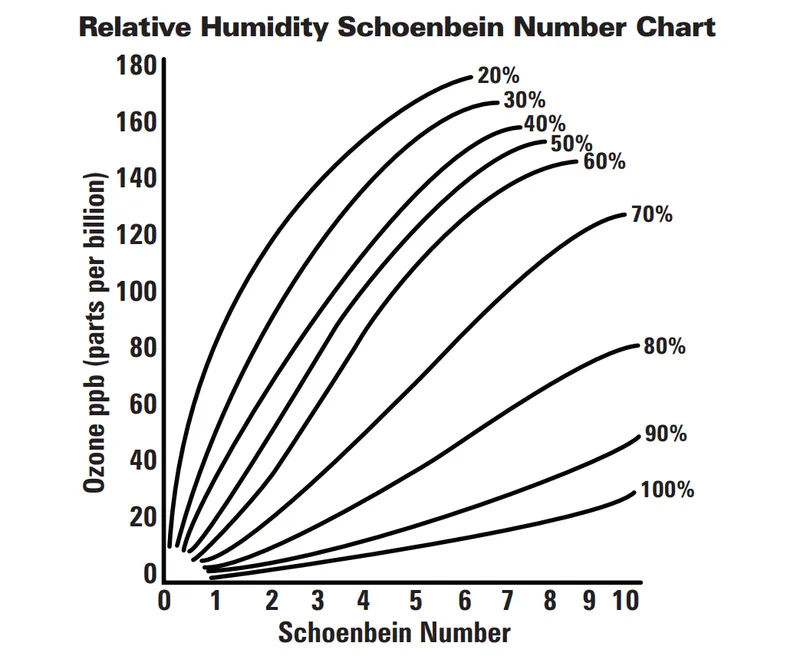
It is important to perform this experiment in days with low humidity (the lines from the graph represent how the Schoenbein numbers vary based on the different percentages of humidity in the air). Under these circumstances, ozone would be more likely to break apart into atmospheric oxygen. This experiment also yields the best results in the ozone season, which occurs during heated temperatures throughout the summer and in areas with high vehicle activity.
While this method is relatively safe, it is advised to perform this under the supervision of Chemistry teachers who can provide them with the chemicals and laboratory equipment needed.
Surface Wipes
Surface wipes are similar to the sticky tape method, which simply involves wiping a cotton bud on a surface to observe how much PM was released in a particular time or area. Students can compare the cotton buds that were wiped on the surfaces that are more exposed to the ones less exposed to pollutants, such as on the opposite sides of a handrail or bench. The following video is a lighthearted and entertaining experiment performed by a YouTuber from Sydney to observe the city’s air quality, which has dramatically worsened as of late due to the Australian bushfires:
Conclusion
Teachers and students are encouraged to be creative, improvise and innovate experiments similar to this. That way, educators could create a stimulating and critical learning environment for students to teach them about scientific research methods.
As a teacher or parent, you can choose from a myriad of creative options to teach your child how to measure air quality. Depending on their style of learning and personal preference, you can weigh the benefits of performing qualitative or quantitative methods to help them understand the state of the environment. By performing diverse experiments, they would be able to understand how different collection methods result in corresponding data types. After experimenting with multiple methods, they can then determine which type would be the most suitable to fulfill the research’s purpose. We hope that these experiments would be able to pique their curiosity and encourage them to make meaningful discussions about the health effects and environmental impacts of air pollution!