Keeping classroom air clean during Chiang Mai’s smoke season means dealing with changing outdoor pollution while school life continues. Students move between lessons, teachers open doors to the outdoors, and classrooms fill and empty throughout the day. An air-cleaning system needs to maintain its performance through all of this, day after day. To understand how different approaches perform under these conditions, we examined air quality in classrooms and other indoor spaces at a school in Chiang Mai, Thailand, across two consecutive smoke seasons.
The school uses both air purifiers and professionally installed positive pressure systems (PPS), allowing us to compare their performance during everyday operation. Our analysis covers March and April of 2025 and 2026, using only measurements collected between 8 a.m. and 3 p.m. on weekdays. By comparing indoor PM2.5 concentrations with outdoor conditions, we assessed both how clean each group’s air remained and how strongly it responded to rising outdoor pollution.
The included PPS installations delivered substantially cleaner air in both years. Their average indoor PM2.5 concentrations were approximately 86% lower than the air purifier comparison group in 2025 and 71% lower in 2026. They also maintained a much smaller increase in indoor PM2.5 as outdoor pollution rose.
These results provide evidence of performance across two smoke seasons in an operating school, with regular classes and doors opening to the outdoors.
Two approaches to cleaner classroom air
An air purifier draws in room air, passes it through a filter and returns it to the room. Repeated circulation removes particles, but outdoor pollution can continue entering through gaps and open doors. The result depends on how much clean air the purifier delivers relative to the pollution entering or being generated indoors.
A positive pressure system supplies filtered outdoor air. With sufficient supply airflow, it raises indoor pressure slightly, encouraging air to leak outward rather than drawing polluted air inward. This can reduce the particle load entering the room as well as supplying cleaner air.
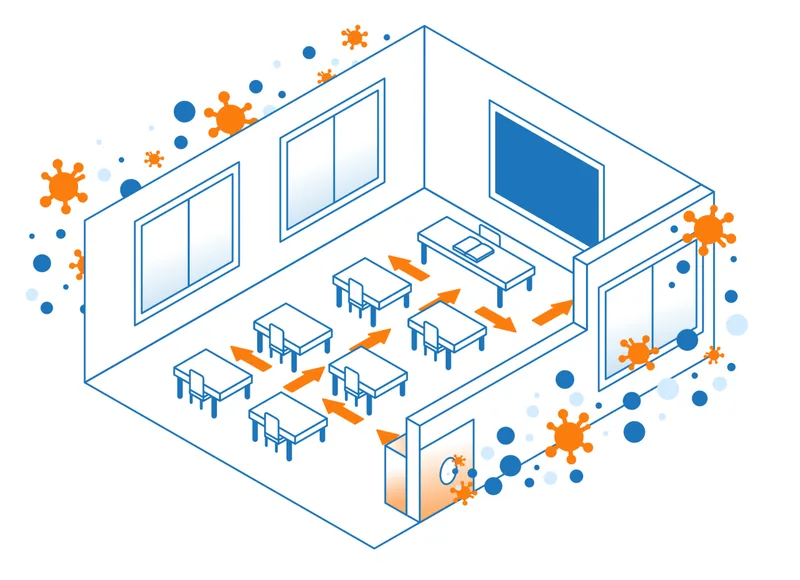
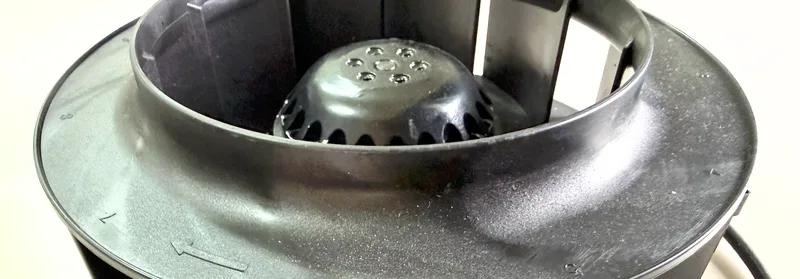
That advantage depends on the installation. The filter and housing must prevent unfiltered bypass, the fan must deliver sufficient airflow through the filter, and the room must be enclosed enough to sustain pressure. Maintenance matters as filters load and airflow changes. Normal door use is a design challenge; permanently open doors or windows can overwhelm a system.
Our earlier article, How Positive Pressure Keeps Dirty Air Out: The Physics of Clean Classrooms, explains these requirements in more detail.
What does existing research tell us?
Published research supports the potential of both approaches, but long-term, direct field comparisons between PPS and air purifiers appear scarce.
A randomized crossover study in Los Angeles schools followed classroom air quality from July 2022 to June 2023 and found benefits from portable HEPA air cleaners. However, it compared HEPA and non-HEPA devices in classrooms that already had filtered HVAC systems, rather than comparing air purifiers with PPS.
Research in Bangkok examined air quality in ten school rooms and introduced a positive pressure fresh-air system in one classroom, reporting particulate concentrations below 20 µg/m³ throughout the class day. This provides relevant field evidence for PPS, but does not establish a comparison with air purifiers across successive smoke seasons.
Related comparisons also show why the details matter. A study of 33 classrooms in Beijing compared naturally ventilated rooms with air cleaners against rooms with mechanical fresh-air ventilation. Neither arrangement adequately controlled PM2.5 during severe outdoor pollution. Mechanical ventilation alone should therefore not be assumed to deliver the performance of a well-designed, highly filtered PPS.
Our targeted literature search did not identify a peer-reviewed study directly comparing these two arrangements across consecutive smoke seasons. This school dataset contributes an observation of how installed systems perform over repeated pollution periods during everyday use.
The school and the measurements
The school has professionally installed, ceiling-mounted PPS in many classrooms and other indoor spaces. These systems are demand-controlled: their operation responds to indoor air-quality measurements. Other spaces use air purifiers and form the comparison group.
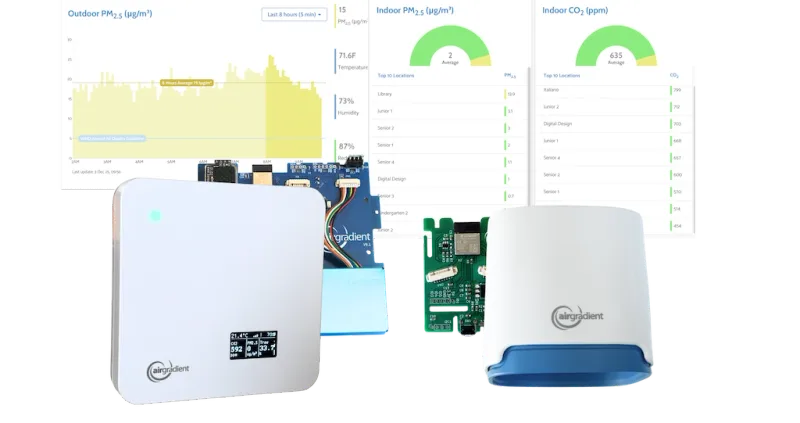
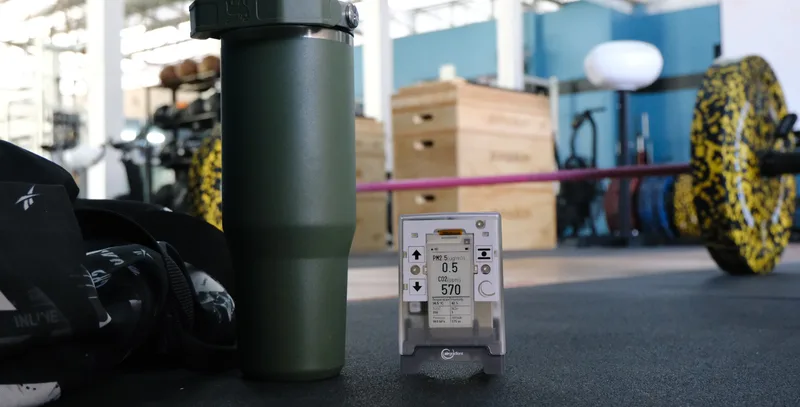
Each monitored indoor space has an AirGradient ONE monitor measuring continuously, with data retained at hourly intervals. Three outdoor monitoring locations provide a reference for conditions around the campus.
For this analysis, we considered only 08:00–15:00 on weekdays during March and April of 2025 and 2026. Restricting the analysis to school opening hours avoids disadvantaging air purifiers that may be switched off after school. The technology classification for each space was the same across both years.
The analysis uses daily averages of corrected PM2.5 during these opening hours. Available observations cover 33 dates in 2025, from March 3 to April 16, and 44 dates in 2026, from March 2 to April 30. There are no observations for the remainder of April 2025 in this dataset.
| Included locations with data | 2025 | 2026 |
|---|---|---|
| Outdoors | 3 | 3 |
| Air Purifiers | 9 | 9 |
| PPS | 40 | 43 |
| Total Classrooms | 49 | 52 |
Eight malfunctioning or non-maintained PPS were excluded; the PPS results describe the remaining installations.
This is an observational comparison of systems in everyday use. Rooms were not randomly assigned a technology, and differences in the spaces, equipment sizing, maintenance and operation may contribute to the results.
Lower indoor PM2.5 in both smoke seasons
The first comparison follows daily conditions through each season. For each recorded day, we average the opening-hours PM2.5 concentrations across reporting locations in each group, giving each location equal weight. The outdoor series is calculated in the same way from the outdoor monitors.
Each daily value averages reporting locations equally. Dashed horizontal lines show the mean of the daily values. The horizontal axis connects consecutive recorded weekdays, omitting weekends. There are 33 recorded dates; data for April 17–30 is unavailable. Included locations with data: 3 outdoors, 9 Air Purifiers and 40 PPS; daily reporting counts vary.
Daily average PM2.5 from March 3 to April 16, 2025, during 08:00–15:00 on weekdays. Outdoors averaged 58.7 µg/m³, the air purifier group 24.2 µg/m³, and the PPS group 3.4 µg/m³.
The averaging method and vertical scale are the same as in the 2025 figure. Dashed lines show the mean of the daily values. Weekends are omitted from the horizontal axis. There are 44 recorded dates. Included locations with data: 3 outdoors, 9 Air Purifiers and 43 PPS; daily reporting counts vary.
Daily average PM2.5 from March 2 to April 30, 2026, during 08:00–15:00 on weekdays. Outdoors averaged 87.8 µg/m³, the air purifier group 17.4 µg/m³, and the PPS group 5.0 µg/m³.
The average of those daily group means shows a clear difference:
| Average opening-hours PM2.5 | 2025 | 2026 |
|---|---|---|
| Outdoors | 58.7 µg/m³ | 87.8 µg/m³ |
| Air Purifiers | 24.2 µg/m³ | 17.4 µg/m³ |
| PPS | 3.4 µg/m³ | 5.0 µg/m³ |
In 2025, the PPS group averaged 3.4 µg/m³, compared with 24.2 µg/m³ in the purifier group. The PPS average was approximately 86% lower.
Outdoor pollution was higher over the available dates in 2026, averaging 87.8 µg/m³. The PPS average increased to 5.0 µg/m³, but remained approximately 71% below the purifier group’s 17.4 µg/m³. This means that even in a very polluted time of the year, the classrooms were able to hold the strict WHO annual guidelines of 5.0 µg/m³.
The purifier-equipped spaces also had substantially lower average concentrations than outdoors. However, the included PPS installations maintained a much lower indoor PM2.5 level in both seasons. Their advantage was visible across the analysed school days, rather than depending on one selected pollution episode.
The year-to-year figures should be read as performance during each year’s available observation period. They do not by themselves establish changes in equipment condition: outdoor conditions, reporting locations and coverage also differed.
How often was the air in the “Good” category?
Seasonal averages are useful, but they do not show how frequently individual spaces experienced cleaner or more polluted air. To examine that, we classified each location’s opening-hours daily average using the US EPA’s PM2.5 concentration bands, including the updated “Good” range of 0–9 µg/m³. EPA category breakpoints.
Figure 4. Air quality in classrooms during two smoke seasons at a school in Chiang Mai, Thailand
Outdoor conditions, air purifiers and positive pressure systems in classrooms and other indoor spaces, March–April 2025–2026. Each pie groups opening-hours daily PM2.5 averages into US EPA concentration categories. Slice labels show the percentage and observation count.
Counting: One location measured on one day counts as one observation. Totals are 226 observations from 3 outdoor monitors, 666 from 9 air purifier locations, and 3,032 from 43 PPS locations across 77 recorded dates. Percentages use each group’s total; locations with more recorded days contribute more. Percentages may not sum to exactly 100% because of rounding.
Categories: The EPA PM2.5 breakpoints, including “Good” at 0–9 µg/m³, are applied as reference bands. Opening-hours averages are not official 24-hour AQI classifications.
The contrast is substantial. Only 2.7% of outdoor observations fell in the “Good” band. For the purifier group, the proportion was 35.1%. For PPS, it was 87.3%.
| PM2.5 reference category | Outdoors | Air Purifiers | PPS |
|---|---|---|---|
| Good | 2.7% | 35.1% | 87.3% |
| Moderate | 14.6% | 46.7% | 12.3% |
| Unhealthy for Sensitive Groups | 25.7% | 13.7% | 0.4% |
| Unhealthy | 43.8% | 4.5% | <0.1% |
| Very Unhealthy | 12.4% | 0% | 0% |
| Hazardous | 0.9% | 0% | 0% |
In the PPS group, 2,646 of 3,032 observations were in the “Good” band. Only 13 observations were above the “Moderate” band. In the purifier group, 234 of 666 observations were “Good,” while 121 were above “Moderate.”
Here, one observation means one location on one recorded day. These are not thousands of separate calendar days, nor percentages of individual hours. Each pie uses its own group’s total, and locations with more recorded days contribute more observations. Percentages may not sum to exactly 100% because of rounding.
The EPA bands are reference categories in this analysis. Applying them to opening-hours averages does not establish official 24-hour AQI classifications, and a low daily average does not mean every hour was equally clean.
Less sensitivity to rising outdoor pollution
The final comparison asks how much indoor PM2.5 rose when outdoor pollution increased.
We matched each day’s indoor group means with the outdoor mean for the same date. This gives 77 matched dates across the two years, with one point per date for each indoor technology. A fitted regression line describes how each group’s indoor concentration changes with outdoor pollution.
Figure 5. Indoor PM2.5 as outdoor pollution rises
The combined 2025–2026 data show lower indoor concentrations and a smaller response to outdoor pollution in PPS-equipped spaces. For every additional 100 µg/m³ outdoors, the fitted indoor average increased by approximately 12.7 µg/m³ for Air Purifiers and 4.3 µg/m³ for PPS.
Each point represents a group’s opening-hours mean on one of 77 matched dates. Reporting indoor locations are averaged equally each day; the outdoor reference averages reporting monitors from the three outdoor locations. The lines are ordinary least-squares fits with freely fitted intercepts, shown only across observed outdoor concentrations. The dashed diagonal marks equal indoor and outdoor concentrations.
Reference thresholds: The blue band marks 0–5 µg/m³, using the WHO annual-mean guideline as a reference. The horizontal dashed line marks the EPA “Good” upper breakpoint of 9 µg/m³.
The fitted slope is approximately 0.127 for Air Purifiers and 0.043 for PPS.
For every additional 100 µg/m³ outdoors, the fitted indoor average increased by about 12.7 µg/m³ in purifier-equipped spaces, compared with 4.3 µg/m³ in PPS-equipped spaces.
The PPS rooms were therefore much less sensitive to changes outside. Their indoor concentrations remained relatively stable despite large changes in outdoor pollution, while also staying much lower overall. This is consistent with the protection that filtered supply air and positive pressure are intended to provide.
The relationship was not completely flat: outdoor pollution still mattered. But the increase associated with rising outdoor PM2.5 was approximately two-thirds smaller for PPS in the combined fit. The PPS slope was also lower when each year was analysed separately, so the difference was not simply a consequence of combining the two seasons.
What schools can take from these results
Across both smoke seasons, the included PPS installations delivered substantially lower indoor PM2.5 than the air purifier comparison group during school opening hours. They achieved “Good”-band daily averages much more frequently and showed a smaller response to worsening outdoor pollution.
For schools facing repeated smoke seasons, these findings make a strong case for considering properly designed and maintained PPS. The relevant performance measure is the air students and teachers experience during normal use, over many days and changing outdoor conditions.
Installation and upkeep remain part of that performance. Continuous monitoring makes it possible to check whether a system is delivering cleaner air, detect deterioration and direct maintenance where it is needed. For demand-controlled PPS, those measurements can also inform operation.
This comparison comes from one school and its particular installations. Within that setting, the advantage of the included PPS was clear in both years: cleaner air during the school day, maintained across two smoke seasons, with substantially less sensitivity to outdoor pollution.
Further research should test whether these findings hold across more schools, building types and smoke seasons. Comparisons that account for room size, ventilation, occupancy and installed cleaning capacity would help separate the effects of the technology from installation and operation. Following all systems over time—including those that malfunction or receive insufficient maintenance—would also show how reliably each approach performs in practice. Measuring energy use, noise, CO₂ and maintenance costs alongside PM2.5 would give schools a fuller picture of the benefits and trade-offs.