Every few months, somebody asks on our forum or writes to our support team with the same question: when are we going to stop calibrating our CO₂ sensors to a baseline of 400 parts per million (ppm)? On the surface, it's a fair question, and we've now been getting it for years.
The global average carbon dioxide concentration passed 400 ppm back in 2016 and it’s been climbing since. As of the time of writing, NOAA's global monthly mean sits at 428.73 ppm (May 2026 - the most current data), up from 427.04 ppm the same month a year earlier. On paper, this means that a sensor that assumes fresh air means 400 ppm is working from a figure that expired a decade ago.
Header image: Cold air (visible here as fog) trapped under an inversion layer at our farm in New Zealand. Keep reading to learn how this impacts daily CO₂ concentrations!
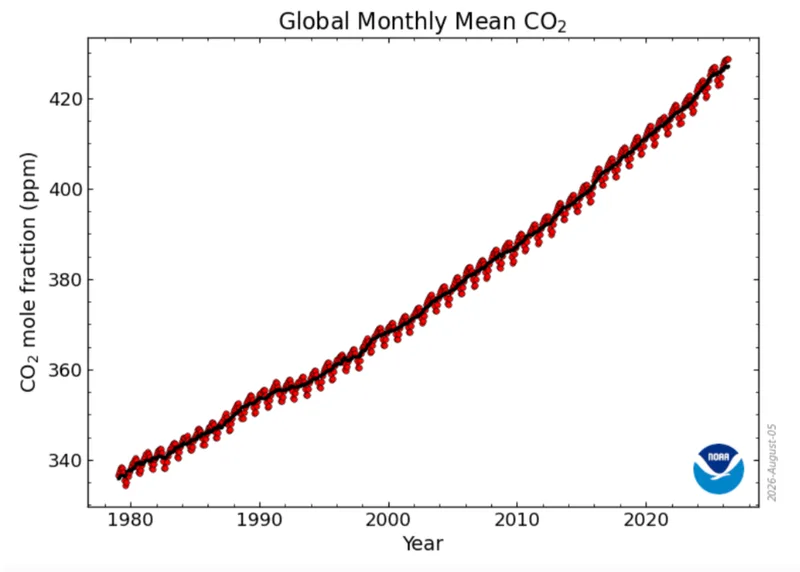
Since the topic keeps coming up, we decided to investigate properly. To do so, we pulled readings from around 1,900 outdoor Open Air monitors across six continents, lined them up against NOAA's global record, and went looking to see how much our monitors deviate from the known concentration.
Personally, I went in expecting our outdoor monitors to read close to 30 ppm low, which is what you would expect from a monitor calibrating to a point approximately 30 ppm lower than the actual ambient concentration. But what we found instead was far more interesting: the sensors were reading much closer to what they should be, and by the time I'd finished going through the data, I was no longer sure that 400 ppm is the wrong number at all.
In this article, I'll explain how CO₂ self-calibration actually works, what our outdoor monitor fleet read through 2025, and why outdoor CO₂ has a daily rhythm that reframes the whole question. Let's dive in!
What Does the 400 ppm Baseline Actually Do?
NDIR sensors - the type used in AirGradient monitors and many other monitors - drift. The infrared source dims slightly each year, the detector ages, and the optics can also collect dust over time. For these reasons, if a sensor was accurate out of the box it would be reading noticeably wrong a few years later without some kind of intervention.
The industry answer is ABC, or automatic baseline correction (Sensirion calls it ASC). The sensor tracks the lowest CO₂ value it has seen over a rolling window, which is 180 hours on the Senseair S8 we use, so a bit over seven days. It then assumes that this minimum must have been fresh outdoor air and moves its zero point until the minimum lines up with 400 ppm. As an example, if the lowest concentration your monitor sees in one week is 428 ppm, the sensor will assume that it is actually 400 ppm and slowly change the values, giving you a systematic 28 ppm offset once the cycle completes.
Indoors, this logic usually works well. Offices and classrooms typically empty overnight, bedrooms get aired out, and at some point in most weeks the CO₂ in a normal room falls back to something close to ambient outdoor air. The sensor takes that weekly low as its reference, corrects itself, and the cycle repeats - which is why an NDIR sensor can run for a decade in a school corridor without anyone ever needing to recalibrate it.
There's a catch, though, because the air a room falls back to isn't 400 ppm. Outdoor air now sits around 428 ppm (and climbs by about 2 ppm every year), and a room's weekly low usually lands a little above even that. ABC labels it 400 anyway.
However, this matters much less indoors than you might think. To decide whether a room needs ventilating, you're comparing something like 450 ppm against 1,400 ppm, and next to a gap that wide, a fixed offset of 20 or 30 ppm barely registers. What an indoor monitor needs is consistency rather than absolute accuracy, and consistency is exactly what ABC delivers.
With this in mind, my theory going in was that if ABC does what the mechanism says it does, our outdoor monitors should read low by something in the region of 30 ppm. Let’s move on to our test setup!
How Do You Test 1,900 Monitors at Once?
The usual way to test a sensor is inside a chamber, by exposing the sensor to a known gas or particle mixture. Chamber testing is the gold standard because it’s controllable, but it only tells you how one unit behaves on a single day. It tells you nothing about a sensor two years into a rooftop deployment in Bangkok, sitting through monsoon rain and 40 degree afternoons while quietly re-calibrating itself the whole time.
For that, you need lots of units over a long stretch of time. Luckily, for CO₂, a reference already exists, and it’s one we don’t need a chamber for: the atmosphere itself.

CO₂ mixes through the atmosphere on a timescale of about a year, so the background concentration over Berlin and the background over Manila are close to the same number. No other gas or particle we measure behaves this way. A PM2.5 reading depends on the road 50 metres away, and NO₂ barely survives the trip across a city, which is why colocation studies for those pollutants are expensive and always small.
The CO₂ background, however, is measured continuously by NOAA and the WMO's Global Atmosphere Watch network - 179 stations worldwide, with a stated uncertainty of around 0.2 ppm. As Siriel from our science team put it: this is a global colocation exercise, with the atmosphere acting as one massive reference chamber.
What Did the Fleet Actually Read?
We started by looking at data from a single month at daily resolution. We selected November 2025 (our most recent full month of data at the time), and on any given day we had between 1,817 and 1,977 outdoor monitors reporting data - all using the same sensor model, spread across six continents. As far as we're aware, that makes this one of the largest open datasets of outdoor CO₂ measurements available, and it has only grown since. As of publishing this article, the fleet has passed 2,400 outdoor monitors.
If we take the median reading across the fleet for each day and average them, we get 423.4 ppm. The global background over the same month sat around 426 to 427 ppm. That's a difference of roughly 3 ppm - not 30, like I expected. The day-to-day spread was quite tight too, with daily medians moving between 415 and 428 ppm and a standard deviation just over 3 ppm.
For a consumer-grade monitor, 3 ppm is nothing. Not only are the accuracy specs for sensors in this range normally ±30 to ±50 ppm, but if ABC had been dragging the outdoor sensors toward 400 the way I understood the mechanism to work, this gap should have been roughly ten times wider.
Why the median rather than the mean? Because the mean tells you more about the outlying monitors than the normal ones. A monitor beside a busy road or a vent can sit hundreds of ppm above background, but nothing can sit far below it, so the outliers only pull the data in one direction. This is the reason that the November data puts the fleet medians in the low 420s while the fleet averages around 440 ppm. The median ignores these outliers, which makes it a far better estimate of what a typical monitor reads.
Of course, one month is only a snapshot, so we widened out to weekly medians running from late March to mid-December 2025. The fleet median climbs from 414 ppm to 426 ppm over that stretch. That’s 12 ppm, while the atmosphere itself only managed about 0.65 ppm. Some of this may be due to the increasing fleet size (the monitor count more than doubled over this time), but some of it we can’t explain yet.
Looking at this graph, the strangest part for me is what’s missing from the weekly series: the seasonal cycle. CO₂ has a strong annual rhythm driven by northern hemisphere plant growth, and it's larger than most people expect. Concentrations peak in May, fall through the growing season as leaves pull carbon down, bottom out in September, then climb back up through winter. At Barrow in Alaska, the swing runs 13 to 19 ppm depending on the year, and Mauna Loa manages about 6. South of the equator the cycle nearly disappears (under 1 ppm at the South Pole) and runs in the opposite phase.
If I had to guess, I would estimate that 75 to 80% of our outdoor monitors sit in the northern hemisphere, with many of them at mid-latitudes where the swing is widest. A fleet like ours should show a noticeable May peak and a September dip. Instead, our weekly medians sit at 416 to 419 ppm in late May and 421 to 423 ppm by September - drifting gently upward across the same stretch where the northern atmosphere records its deepest drawdown of the year.
So I now had two questions I wanted answered: why are the monitors this accurate when ABC should be dragging them down, and where did the seasonal wave go?
Outdoor CO₂ Rises and Falls Every Day
Everything we’ve discussed up to this point has been a summary of something - daily medians, a monthly mean and weekly medians. However, ABC doesn't anchor to an average or a median. It anchors to the single lowest value that the specific sensor sees in a week, and that value happens at a particular hour on a particular day. Averaging whole days together was throwing away the part of the data that could answer my question.
If you've mostly watched CO₂ indoors, it's easy to assume that outdoor air is the flat, consistent reference that indoor air moves around. It isn't. Below is our fleet through a week of June 2026, plotted against each monitor's own local time so the pattern doesn't smear out across time zones.
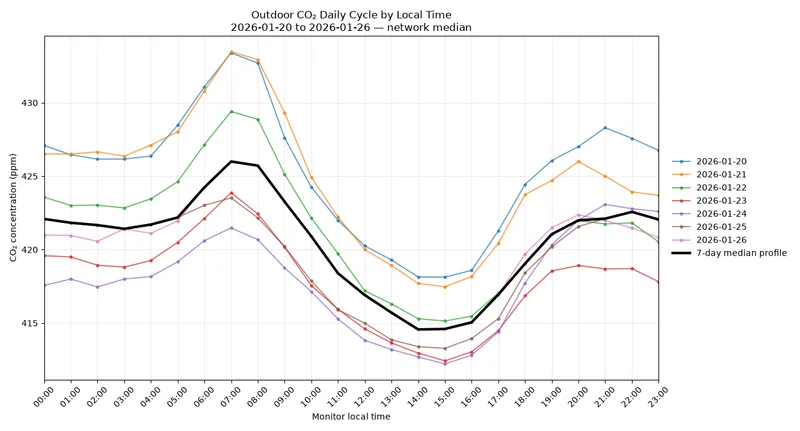
The median monitor peaks near 433 ppm at 5 am and bottoms out around 412 ppm at 3 pm. That's 19-30 ppm of swing, every single day, emphasised by how the seven daily traces sit almost on top of each other in terms of the trend. January does the same thing with the clock shifted: a peak around 426 ppm at 7 am and a trough near 415 ppm at 2 pm. You can see the graph below.
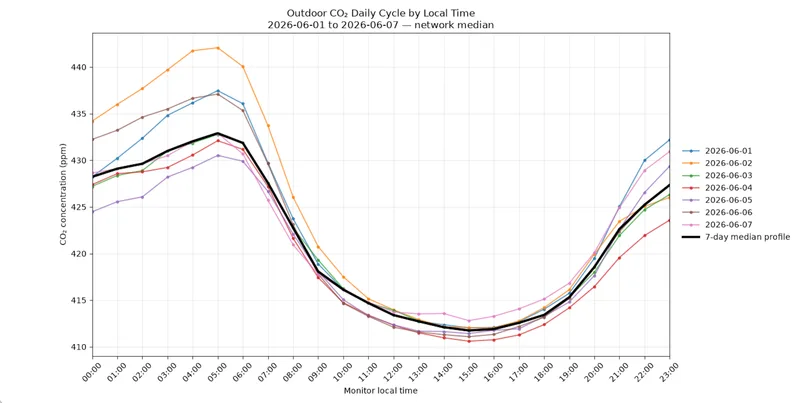
Notice how the peaks are at slightly different times - 5 am in June, and 7 am in January. While I can’t say for certain without knowing the specific location of every single monitor, I’d hazard a guess and say this tracks sunrise, which tells us the driver is the atmosphere rather than anything to do with our monitors. If you've ever wondered why your outdoor monitor reads higher at breakfast time than at lunch, this is the answer.
This mechanism itself is well documented. Overnight, the air near the ground stops mixing, and a shallow inversion layer (sometimes only a few tens of metres deep) traps everything emitted beneath it, including soil and plant respiration, traffic and heating emissions. After sunrise, the ground warms and convection mixes that build-up through a kilometre or more of air. By mid-afternoon, your monitor is sampling something closer to the global background.
If we look at our numbers next to a published dataset, everything aligns. Five and a half years of measurements at a French reference station in Haute-Provence put the daily amplitude at 6.0 ± 3.7 ppm in winter and 15.9 ± 6.6 ppm in summer at 10 metres above ground. We run wider than that in both seasons, which is what you'd expect from monitors deployed primarily in urban areas (Observatoire de Haute-Provence is located in a rural area).
That brings us to the answer of my first question - why are the monitors this accurate when ABC should be dragging them down? It’s because the lowest value an outdoor sensor sees in a week is not 428 ppm. Rather, it's the bottom of an afternoon trough, often somewhere closer to 410 ppm, depending on the season and location. ABC has been pulling toward 400 from much closer than I assumed, which is why the fleet still lands within a few ppm of our ‘reference chamber’.
Where Did the Seasonal Wave Go?
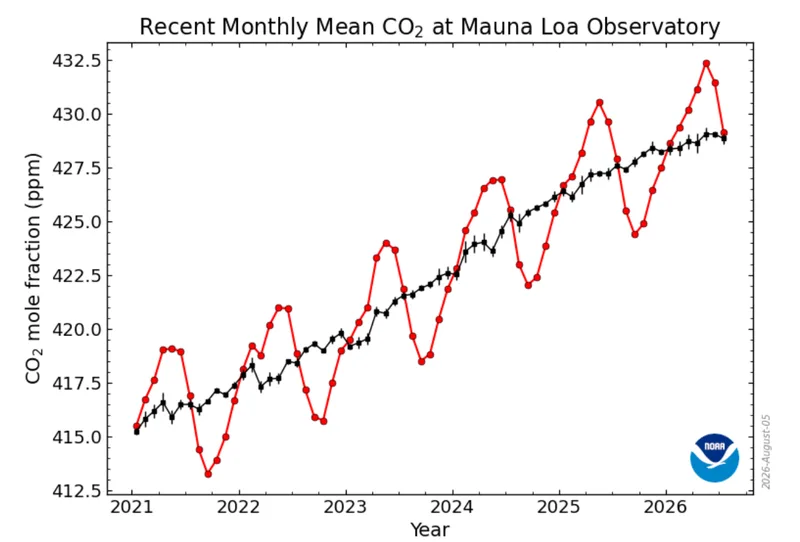
On to my second question, which is, thankfully, easier to explain. The seasonal wave disappears for a simple reason: ABC corrects the sensor faster than the seasons move the air. At least, that's the explanation that best fits our data
Every seven and a half days, ABC re-anchors the sensor to the lowest value it has seen that week. The global background never moves by much more than 2 ppm in a month, and even at a far-northern site like Barrow, where the swing is widest, the steepest months manage perhaps 4 or 5 ppm. Between one re-anchor and the next, that amounts to half a ppm, maybe 1 ppm in the extreme case.
The daily cycle survives because it moves much faster, swinging by 11 to 21 ppm within a single day, which is why it shows up so clearly in the charts above. This is the trade sitting at the heart of ABC. The algorithm has no way to tell a slowly changing atmosphere from a slowly drifting sensor, so it corrects both away and leaves only the fast signals behind.
Where Did the 400 ppm Figure Come From?
I know it’s a slight (or rather large) digression, but while researching for this article, I also came across an interesting finding.
Like most people asking for the baseline to be updated, I'd treated 400 ppm as a stale snapshot of the atmosphere - a number that was accurate once but expired around 2015. With this in mind, I went looking for where it came from. The datasheet for the Senseair K30, the platform ABC grew up on, describes the algorithm exactly as it still behaves today: the lowest reading over a 7.5 day interval, corrected toward "the expected fresh air value of 400 ppm CO2", with the correction speed capped at about 30 ppm per week.
However, the patents printed on that same datasheet reveal something quite interesting. The self-calibrating gas detector patent (WO 2005/015175) was filed in 2003 and published in 2005, when the global annual mean was 378.98 ppm. The 400 ppm figure appears in the patent text itself, which describes setting the reference "to a value of say 400 ppm, corresponding to the carbon dioxide concentration of fresh air", adjustable anywhere from 350 to 450 ppm if an application calls for it. This is all to say, 400 ppm was never selected because it was representative of ambient air.
So What Should the Number Be?
With the daily cycle in hand, we can now do that arithmetic properly, and the answer depends entirely on the monitor.
As an example, let’s take a suburban monitor in July where the background sits around 429 ppm. Subtract an afternoon dip of 16 ppm, then a few more because ABC picks the single lowest afternoon out of seven rather than a typical one, and the weekly minimum lands somewhere near 410 ppm. For that monitor, in that month, 400 ppm is a better ABC target than 430 would be. If we set it to 430, ABC would push the sensor upward instead, introducing a positive bias where there wasn't one.
If we run the same sum in January, we get about 420 ppm, making 400 around 20 ppm too low (assuming the Observatoire de Haute-Provence winter amplitude findings). Run it for a monitor near a busy road, where the minimum never falls far, and 400 can be 40 ppm too low.
So, is 400 ppm the right number? For some monitors, in some months, it is the better number (and I realise how unsatisfying that answer is). There is no single constant that works for every location and season, and we’d essentially be replacing one incorrect constant with another one.
Could We Change It Anyway?
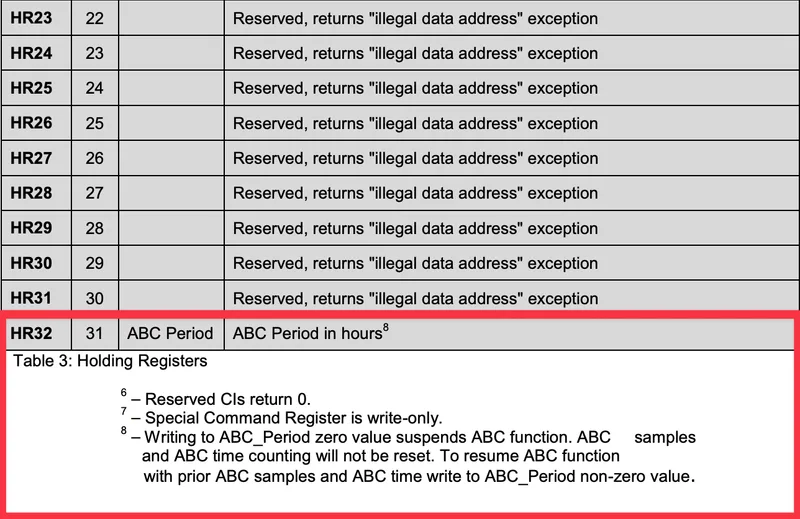
I probably should’ve addressed this question at the start of the article, but that would have ended it in just a couple of paragraphs and wouldn’t have led to this rather interesting investigation! On our current hardware, we can’t change the ABC baseline anyway. Going through the S8's Modbus specification, the sensor exposes exactly one ABC parameter: the correction period. You can read it, change the interval, or write zero to suspend ABC entirely, but there is no register for the 400 ppm target, and the built-in background calibration command also assumes 400 ppm. On the S8 (and S88), the target simply isn't adjustable.
Senseair's Sunrise sensor is different, though, as it exposes an ABC target register, and Senseair explicitly recommends changing the value depending on where the sensor will be deployed.
Of course, there's always a workaround. Since we control the monitor's firmware and the dashboard, we could simply add 30 ppm to every outdoor reading and call the baseline corrected. We're choosing not to. The error this article has been chasing isn't a constant - it runs from a handful of ppm for a suburban monitor in summer to 40 ppm beside a busy road. Using a single offset would push some monitors into reading high while still leaving others low.
On the other hand, if we allow users to individually enter an offset value, we end up with a map of outdoor monitors that can’t be compared anymore. Sure, we could mention the offset value in the API, but we wouldn’t know the conditions of the device’s calibration. Was it calibrated to the concentration at 8 am or 3 pm? Did the user even calibrate it to the correct value? Simply put, the monitors would no longer be comparable and this is very important for us as many of our indoor and outdoor sensors contribute data to global datasets for research.
There's also a trap here if you're planning to manually calibrate your own monitor to 430 ppm and call it done. A 30 ppm manual correction sits inside ABC's 30 to 50 ppm of authority per period, so ABC will quietly undo your calibration over the following few weeks, and you'll never see it happen. Holding any other value means suspending ABC first, and suspending ABC means taking on multi-year sensor drift with nothing automatic to catch it. That's a real trade, and not necessarily an improvement.
If You Calibrate, Do It in the Afternoon
In the end, the single most useful thing to come out of this investigation has nothing to do with the target number. Rather, it's about when you should calibrate your devices if you decide to manually calibrate them.
Firstly, keep in mind what a manual calibration actually does on our monitors: it tells the sensor that the air it's breathing right now is 400 ppm and while you can't hand the sensor a better number, you can choose the air.
Between roughly noon and 4 pm local time, the boundary layer is deep, the air is well mixed, and outdoor CO₂ is at its daily minimum - as close to that 400 ppm assumption as the real world gets, and the same afternoon air ABC anchors to every week. Calibrating then bakes in the smallest possible offset, and the automatic correction afterwards will agree with that figure. It’s worth noting that this is also the window reference networks like ICOS prefer to sample in, for the same reasons.
If you calibrate at 5 am (you’d have to be very keen to do this!) you will get the opposite. Our June fleet median ran 19 to 30 ppm higher at 5 am than at 3 pm, so a morning calibration writes an extra 20-odd ppm of low bias into the sensor compared with an afternoon one. If ABC is running, it will spend the next few weeks quietly walking that error back out. If ABC is disabled, that error will remain.
Conclusion
So, should we stop calibrating our CO₂ sensors to 400 ppm? I went into this investigation expecting our outdoor monitors to read something like 30 ppm low, and instead found a fleet sitting surprisingly close to the global background. The reason is the daily cycle: outdoor CO₂ swings 11 to 21 ppm between dawn and mid-afternoon, and ABC anchors to the bottom of that swing, which sits far closer to 400 than I assumed.
Since no single replacement constant would suit every site and season, and because individual calibration offsets would cause consistency issues with our global database, we’ve decided not to change the baseline value at this time. Of course, if you have a private monitor that isn’t sharing data, the devices are open source and you can either apply an offset on the firmware level or in software like Home Assistant.
I also want to mention that these small deviations from the true ambient concentration don’t defeat the purpose of including a CO₂ sensor on our outdoor monitors. We never really expected absolute accuracy from outdoor CO₂ measurements, and the sensor was included to help spot local emission hotspots - a passing plume or the morning rush hour - which are the kind of fast signals that ABC leaves untouched.