Total Volatile Organic Compounds (TVOCs) refers to a broad group of chemicals that easily evaporate into the air at room temperature. This category includes many highly volatile substances that can impact human health, triggering symptoms like headaches and respiratory irritation or even increasing cancer risks after severe exposure. You can commonly find these chemical emissions from everyday items like cleaning supplies, perfumes, paints and building materials.
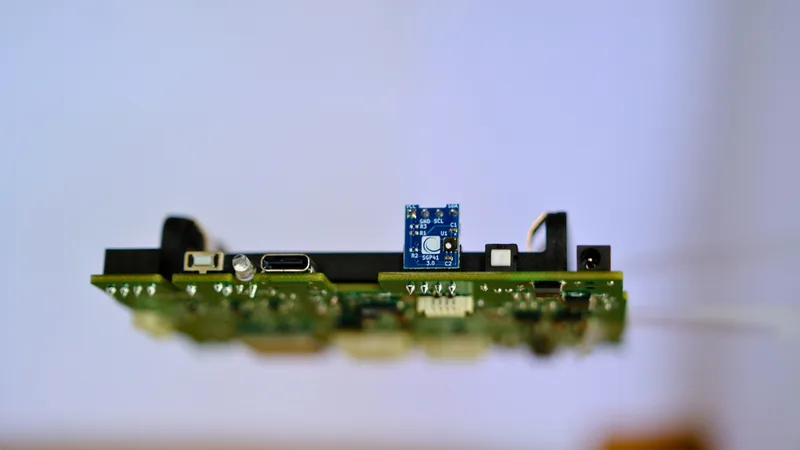
AirGradient uses the Sensirion TVOC sensor to detect these gases; measuring them accurately with low-cost sensors is a well-known challenge. That’s why we rely on Sensirion’s TVOC Index. Instead of giving you a confusing absolute number, the Index provides a relative score from 0 to 500, showing how your current air compares to its usual baseline. (Check out our deep dives on Explaining VOCs and the TVOC Index and the Accuracy of the Sensirion SGP41.)
But here is where things get interesting for us to examine: How do we apply this indoor-focused index to our Open Air Max?
The Open Air Max is our professional-grade outdoor monitor. It’s designed to be placed outdoors, powered by solar and sending data over cellular networks. To save battery power and data, the Open Air Max doesn't stream data constantly. By default, it takes measurements every 3 minutes (180-seconds) and batches them for transmission to our dashboard every 9 minutes. We previously provided the raw TVOC signal in ticks. This value needs to be converted into the TVOC index to make it more meaningful.
Sensirion’s algorithm is built assuming a constant, steady stream of data typically analyzing air every second (1-10 second interval). In fact, using the Sensirion TVOC sensor in our monitor is a great fit for the algorithm, since its sampling frequency matches that of the AirGradient ONE and Open Air with a 1-10 second interval. The algorithm needs this frequent sampling to constantly adjust its baseline and figure out if the current air is better or worse than normal. To implement the TVOC Index on the Open Air Max, we set up an experiment to apply and verify the calculations using the awake-time burst mode (20 data points taken 2 seconds apart). We placed 5 Open Air monitors for the references and 5 Open Air Max monitors in our chamber to compare their performance together and verify the algorithm.
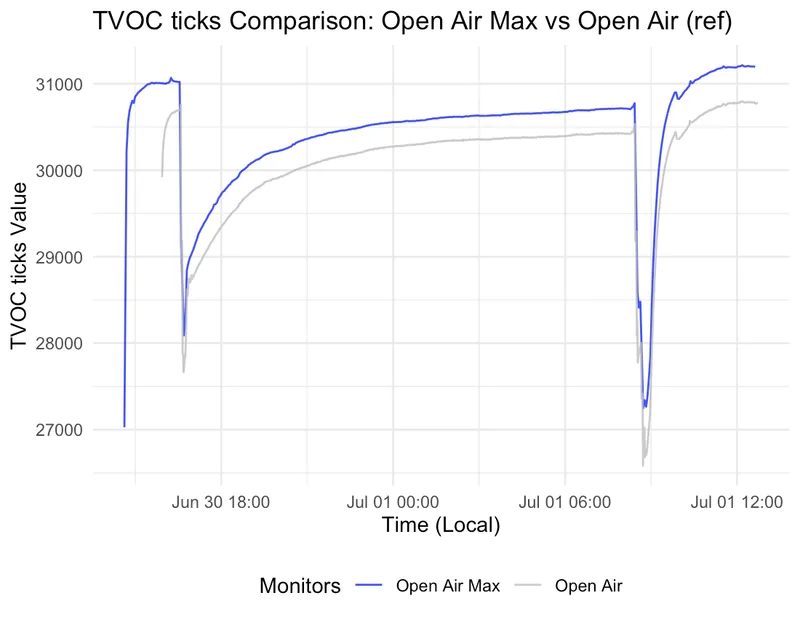
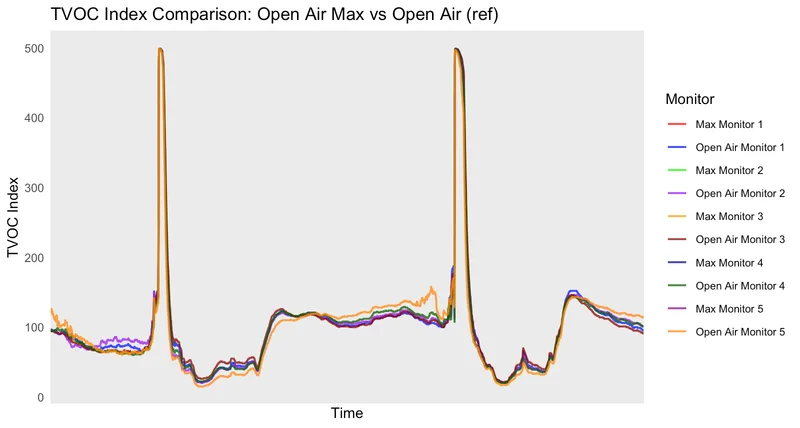
Before calculating the TVOC Index, we verified that the TVOC ticks data between the Open Air and Open Air Max monitors are correlated as expected. Moreover, we referred to Sensirion's official Application Note for the SGP40 VOC Index Algorithm to see their algorithm and apply it to our experiment. The result is in Fig.1.
After the calculation was applied, the results of the dual spike data in our chamber with 5 Open Air Max monitors and 5 Open Air monitors show that all are the same trend and highly correlated, as shown in Fig. 2.
As a result, we decided to use the first 40-seconds of measurements as representative values for the overall 180-second interval. We found that we can't change the algorithm itself, but we can change how we feed it data. Due to the Open Air Max having a 180-second time interval between measurements, we have to fine-tune this data so the algorithm understands it. We do this by taking the reading we get every 180-seconds and calculating how to bridge the gap. We feed the algorithm in a way that simulates the continuous data it expects, ensuring that the historical baseline it builds remains accurate over time, even with less frequent sampling.
We later upgraded the Open Air Max firmware to version 0.10.0 to integrate this TVOC Index implementation on the dashboard. Based on the recent spike test results, the algorithm is performing well, as shown in Fig. 3.
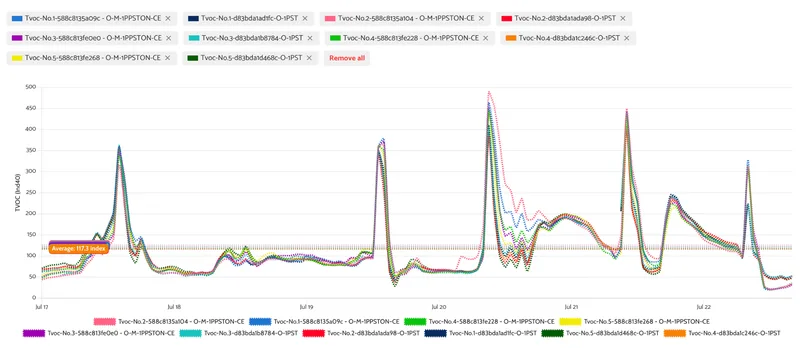
After we ran comprehensive side-by-side comparisons, the data clearly validated our approach. By comparing the TVOC index of the Open Air Max and the Open Air (reference) monitors, our calculations showed a highly consistent trend, with correlation coefficients (r) ranging from 0.91 to over 0.99. This proves that our interpolation method successfully bridges the 180-second polling gap without losing data accuracy. Based on these results, we can summarize our findings: First, the strong correlation (up to r = 0.997) between the Open Air Max and the Open Air monitors confirms that the 3-minute interval algorithm calculates the baseline correctly and captures the exact same trends. Second, we recognize that outdoor ambient conditions, like temperature and humidity drifts, can introduce certain limitations that affect TVOC tick readings. Lastly, even with these ambient limitations and the longer polling interval, this implementation ensures you can use the Open Air Max TVOC Index to reflect relative changes and easily spot pollution trends in your local outdoor environment.