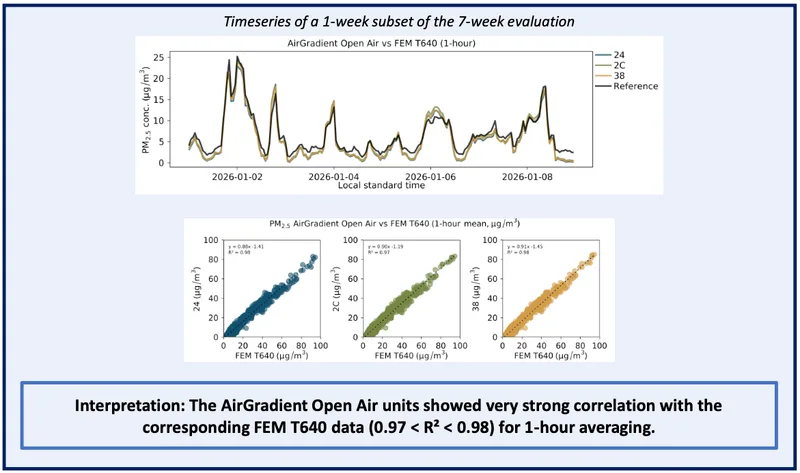
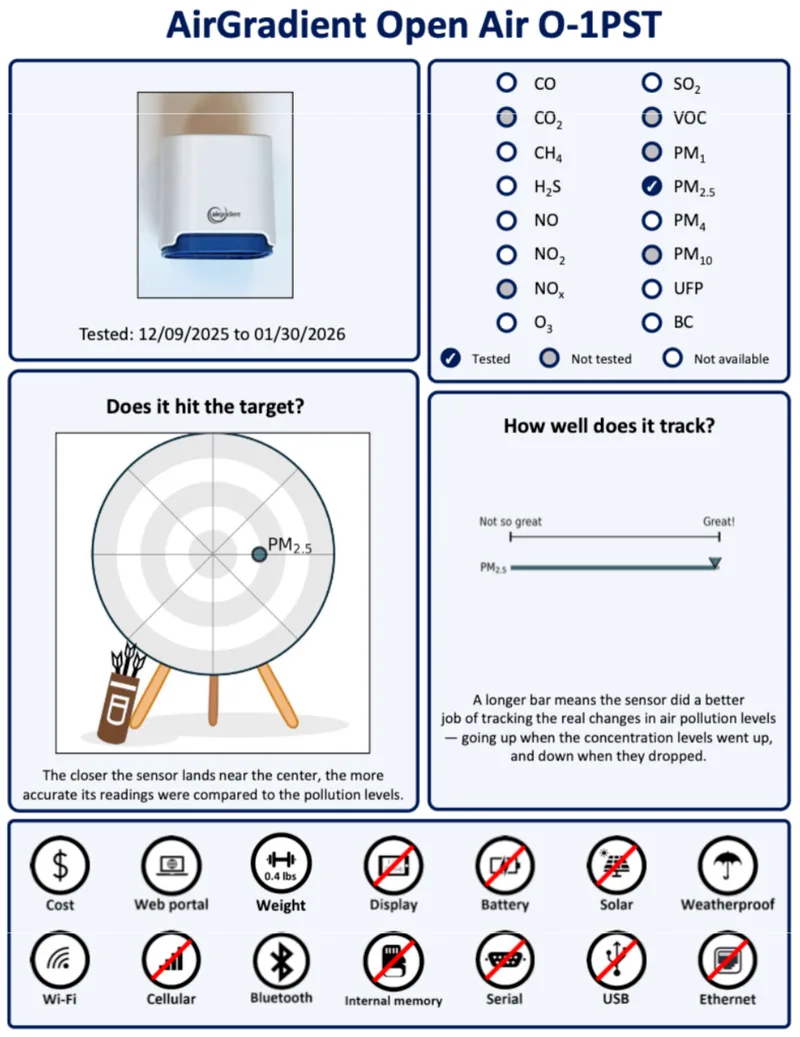
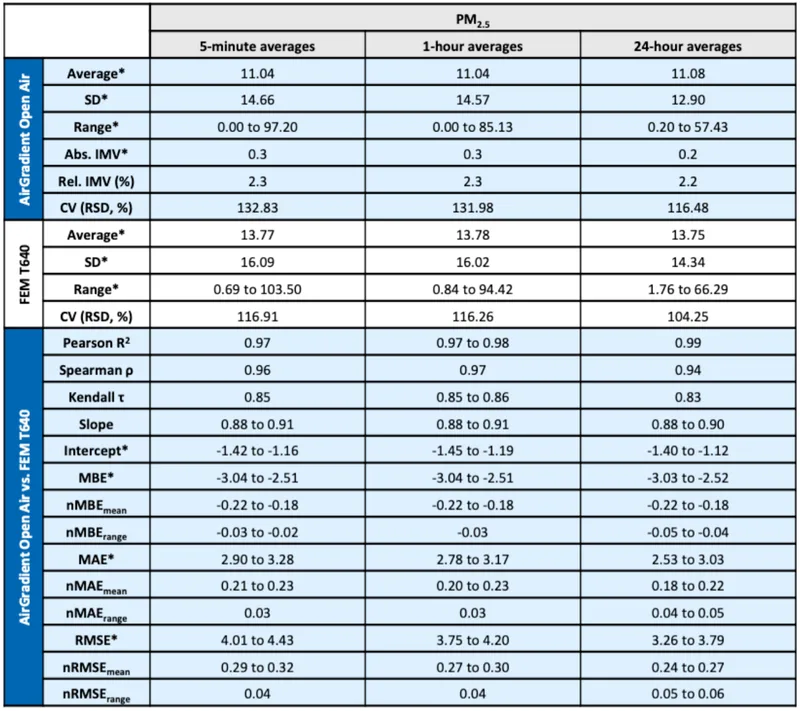
We recently submitted the AirGradient Open Air (O-1PST) to AQ-SPEC, and the result came back very strong. The field evaluation showed a 1-hour PM2.5 correlation (R²) of up to 0.98, along with low error and near-perfect data recovery across three units. By AQ-SPEC’s own reported metrics, this is the strongest PM2.5 R² result of any sensor they have tested so far!
It would be easy for us to announce this and leave it at that. We are proud of the result. But stopping there wouldn’t reflect what we’ve been saying about AQ-SPEC and third-party testing more broadly, for a long time.
If you’ve read our previous articles on AQ-SPEC, you’ll know we haven’t exactly been quiet about its limitations. We’ve written about how R² can make bad data look good, and why AQ-SPEC results shouldn’t be the deciding factor when selecting an air quality monitor. All of those points still apply here.
This is why, for quite a while, we chose not to submit our monitors to AQ-SPEC. We’ve pointed out limitations in how these tests are run and, just as importantly, how the results are often interpreted. Internally, this wasn’t a simple decision either. Some of our team felt strongly that submitting to a program we had concerns about didn’t make much sense.
At the same time, we were regularly asked why we weren’t on AQ-SPEC. Some people assumed we were avoiding it, and others thought we might not perform well. We understood where that perception came from, even if it wasn’t the reason.
In the end (and after many Zoom calls), we decided that even if we don’t fully agree with the methodology, independent testing still matters. No single evaluation is perfect, but more third-party data is always better than less. So, in late 2025, we submitted the Open Air and waited to see how we would perform.
What Is AQ-SPEC?
Many of our readers will already be familiar with AQ-SPEC, but it’s worth briefly explaining for anyone who isn’t.
AQ-SPEC is a program run by the South Coast Air Quality Management District (AQMD) in California. Its primary goal is to evaluate lower-cost air quality sensors and give the public a way to compare how different devices perform.
Manufacturers, including ourselves, can submit their monitors for testing, and AQ-SPEC runs them alongside regulatory-grade reference instruments in both lab and real-world outdoor conditions. The results are then published in a standardized report, with metrics like correlation (R²), error, and data recovery.
Over the past few years, it’s become one of the most well-known public databases for air quality sensor performance, and for many people, it’s the first place they look when comparing monitors and deciding which to purchase.
We value the work AQ-SPEC is doing and see it as an important resource for the industry. Independent testing like this helps move the science forward and keeps manufacturers accountable.
Why AQ-SPEC Results Need Context
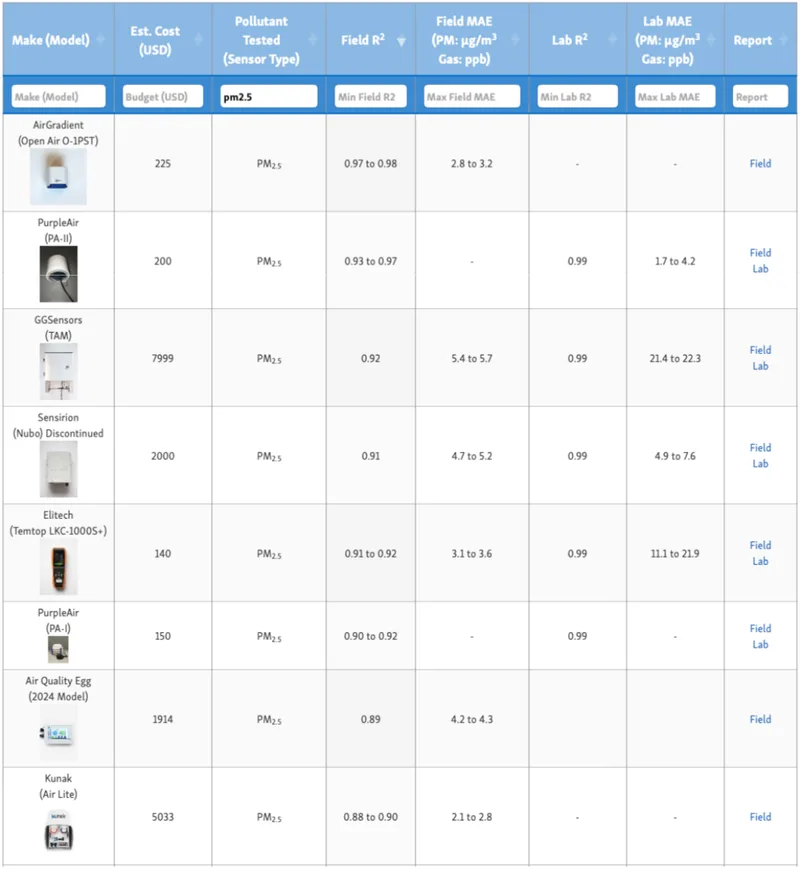
We often see people go to the AQ-SPEC database, sort by the highest R², and assume the monitor at the top is the most accurate. In reality, R² measures how well a device tracks changes, not how close it is to the true value. A monitor can have a very high R² and still report consistently biased readings.
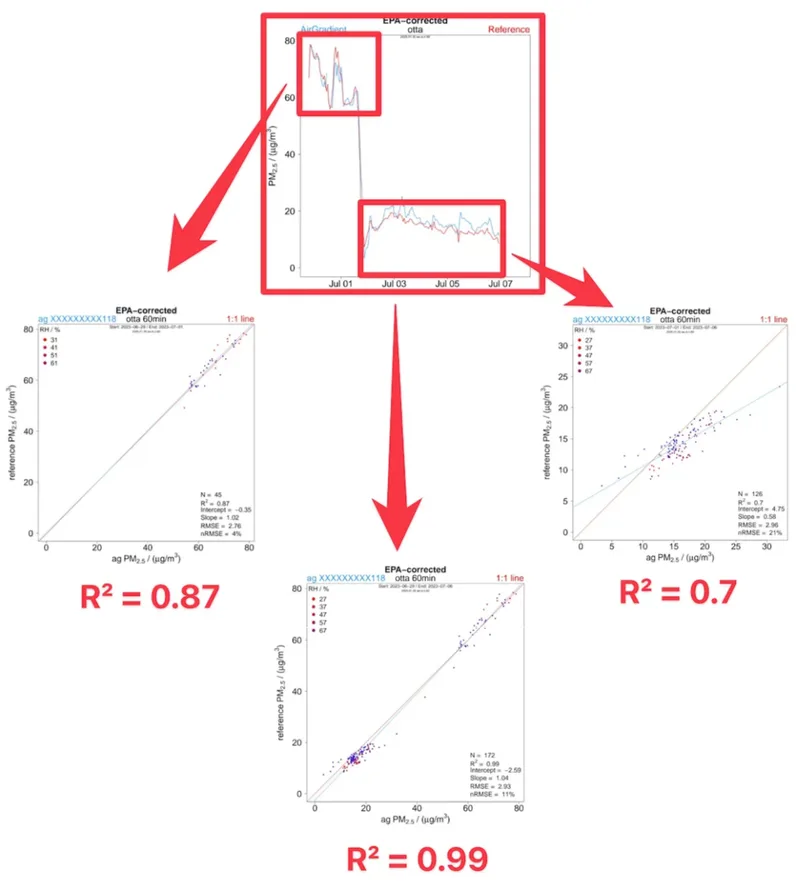
There’s also the question of how the tests are run. Outdoor field evaluations are conducted at different times, under different environmental conditions, and across different concentration ranges. This means two monitors listed side-by-side may not have been tested under comparable conditions at all.
AQ-SPEC does acknowledge these limitations in its methodology and documentation. But in practice, most people never see that context. They see a table of results, a headline number, and make a decision based on that alone.
That gap between what the data shows and how it’s interpreted is what we’ve previously pointed out and want to highlight again today.
Where AQ-SPEC Is Getting Better
One thing we do want to highlight is that AQ-SPEC’s reporting has improved.
In the past, one of our main concerns was how easy it was to focus on a single number, usually R², without enough context around what that number actually meant. The reports were more limited, and unless you went digging, it wasn’t always clear how to interpret the results properly. The newer reports are significantly better.
They now include a clearer summary of key metrics, separate different performance indicators more explicitly, and provide a short explanation of what each metric represents. Instead of everything pointing back to one headline value, there’s more emphasis on looking at the full picture, including error and data recovery.
It’s also easier to see how multiple units of the same device perform relative to each other, which gives a better sense of consistency rather than just a single best-case result.
This doesn’t solve every issue we’ve raised. The way field tests are conducted and compared still requires careful interpretation. But it is a step in the right direction, and we’re glad to see AQ-SPEC moving in this direction.
Why We Think the Open Air Performed Well
This is probably where a normal company would say ‘well, that’s a secret!’, but being AirGradient, we’re happy to share our ‘secrets’. Unfortunately, while I wish there was something interesting to reveal here, there really isn’t. It comes down to what we’ve already shared, a strong focus on testing, calibration, and a consistent commitment to accuracy.
Here are a few things we focus on that we believe contributed to this good result:
- Every unit is individually tested and calibrated
We don’t just purchase sensors and believe the values they provide. Rather, we’ve done extensive testing and individually calibrate every single unit that we ship with our reference station. You can read more about this process here. - We use the PM count to calculate PM2.5 mass as our default calibration method
This came out of an issue we had with differently behaving Plantower PM modules, especially in lower concentration. This method gives more structure and most likely is responsible for better correlation with reference instruments as evident in this AQ Spec test - Designed for real-world conditions
Our validation work is not limited to controlled environments. We spend a lot of time testing in conditions that reflect actual outdoor use, where factors like humidity, temperature, and changing concentrations come into play. We currently have over 25 co-location projects with universities and organisations around the globe. - Continuous improvements over time
The Open Air has gone through many iterations. Firmware updates, calibration adjustments, and hardware changes all contribute to where it is today. This makes the Open Air one of the most regularly updated air quality monitors.
There are so many factors that influence the end results of testing such as AQ-SPEC’s, but we believe these to be a few of the key reasons why we performed so well. Of course, none of this means the monitor will perform the same way in every possible environment. But it does mean that when an independent test is run, we expect stable and reliable behaviour. In this case, that’s what we saw.
Our View Hasn’t Changed
We want to be very clear about one thing: our view on AQ-SPEC has not changed just because we did well in this test.
A strong result like this is something we’re proud of. It shows that the work we’ve put into the Open Air translates into solid performance in an independent evaluation. But it doesn’t change the limitations of the testing itself, or how those results should be interpreted.
R² is still not an accuracy metric. A high correlation tells you that a monitor follows trends well, but it doesn’t tell you how close those readings are to the true value.
Field tests are still conducted at different times, under different environmental conditions, and across different concentration ranges. This means results are not directly comparable across all devices in the database. If our monitor was tested during a different season, it’s possible that we would have had a worse result.
Perhaps most importantly, a single test, no matter how well it’s conducted, should never be the only factor in choosing a monitor.
We may have performed very well on AQ-SPEC, but we would still strongly recommend not basing a purchasing decision on AQ-SPEC alone. We’ve written about this in more detail before, and that position still stands.
Instead, it’s better to look across multiple independent sources. AQ-SPEC is one of them, but there are others, such as AIRLAB and Afri-SET, along with individual co-location studies and long-term evaluations where available. AIRLAB and Afri-SET test all monitors at the same time and thus are better for inter monitor comparisons.
We also want to be clear that we value the work AQ-SPEC is doing. Programs like this play an important role, both for advancing science and for keeping the industry accountable. Our feedback is not about dismissing AQ-SPEC, but about encouraging careful interpretation and continued improvement. The updates to their reporting are a positive step, and we hope to see that continue.
We’re glad we submitted the Open Air. We’re glad to see AQ-SPEC improving its reporting. And we’re glad to have another data point that people can use.